Evidence-Based Medicine
Asking clinical questions, finding evidence, critically appraising studies, applying evidence to patients, hierarchy of evidence, GRADE methodology, clinical practice guidelines, shared decision-making, and every concept and tool needed to practice evidence-based medicine.
01 Overview & History of EBM
Evidence-based medicine (EBM) is the conscientious, explicit, and judicious use of current best evidence in making decisions about the care of individual patients. Rather than relying solely on pathophysiologic reasoning, clinical anecdote, or authority, EBM demands that treatment decisions be informed by the highest quality research evidence available, integrated with clinical expertise and patient values. EBM is not a rigid cookbook; it is a disciplined approach to lifelong learning and decision-making that has reshaped every field of medicine over the past three decades.
Every clinical decision — which test to order, which drug to start, how to counsel a patient — reflects an implicit estimate of benefit, harm, and probability. EBM forces these estimates to be explicit, transparent, and grounded in the best available evidence. Clinicians who practice EBM make fewer errors, avoid outdated interventions, and more effectively translate trial results into personalized patient care.
Historical Development
The conceptual roots of EBM stretch back centuries — Pierre Louis used the numerical method in 1830s Paris to show that bloodletting did not improve pneumonia survival, one of the first statistical critiques of accepted therapy. Archie Cochrane, a British epidemiologist, published Effectiveness and Efficiency in 1972, arguing that medical practice should be based on rigorous randomized trials and systematic reviews; his name now marks the Cochrane Collaboration, founded in 1993 to produce systematic reviews of healthcare interventions.
The term “evidence-based medicine” was coined by Gordon Guyatt at McMaster University in 1991, building on David Sackett’s clinical epidemiology tradition. The landmark 1992 JAMA paper by the Evidence-Based Medicine Working Group formally introduced EBM as a “new paradigm for medical practice.” Since then EBM has expanded into evidence-based nursing, evidence-based public health, and evidence-based healthcare more broadly.
Key Figures in EBM
| Figure | Contribution |
|---|---|
| Pierre Louis (1830s) | Numerical method; disproved bloodletting for pneumonia |
| Archie Cochrane (1972) | Advocated RCTs and systematic reviews as basis for clinical practice |
| David Sackett | Defined EBM; founded the first department of clinical epidemiology at McMaster |
| Gordon Guyatt (1991) | Coined the term “evidence-based medicine”; lead GRADE developer |
| Iain Chalmers | Co-founder of the Cochrane Collaboration |
| Doug Altman | Advanced reporting standards (CONSORT, STROBE, PRISMA) |
Why EBM Matters in Modern Practice
The medical literature doubles roughly every 10–15 years; more than 1 million biomedical articles are indexed annually in PubMed. No clinician can read, let alone synthesize, this volume unaided. Without structured methods for finding, appraising, and applying evidence, practice drifts toward habit, authority, and marketing influence. Studies repeatedly show that routine care lags best evidence by 10–20 years, with many widely used interventions later found ineffective or harmful (e.g., hormone replacement for cardiovascular prevention, routine arthroscopy for knee osteoarthritis, tight glycemic control in ICU patients).
02 Defining EBM & the Three Pillars
The Sackett Definition
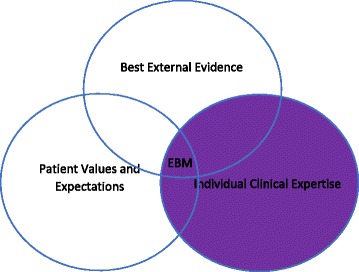
David Sackett’s 1996 BMJ editorial provides the canonical definition: “Evidence-based medicine is the conscientious, explicit, and judicious use of current best evidence in making decisions about the care of individual patients. The practice of evidence-based medicine means integrating individual clinical expertise with the best available external clinical evidence from systematic research.” Sackett emphasized that EBM is neither “cookbook medicine” nor a tool for cost-cutters — it is a method for integrating evidence with clinical judgment.
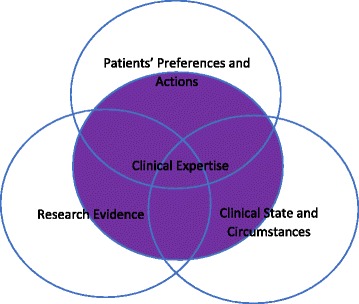
EBM rests on the integration of three components, sometimes visualized as overlapping circles: (1) Best available research evidence, (2) Clinical expertise (the physician’s accumulated skills, pattern recognition, and ability to diagnose and manage individual patients), and (3) Patient values and preferences (the unique concerns, expectations, and circumstances each patient brings to the encounter). Evidence alone is not enough; a decision must fit the patient in front of you.
The Three Pillars in Detail
| Pillar | What It Is | Example |
|---|---|---|
| Best evidence | Results of valid, relevant clinical research — ideally systematic reviews of RCTs | A meta-analysis showing that statins reduce MI by 25% in high-risk primary prevention |
| Clinical expertise | Individual clinician’s skills and judgment gained through training and experience | Recognizing a patient with atypical chest pain who truly has ACS despite a normal initial ECG |
| Patient values | The patient’s unique preferences, concerns, expectations, and circumstances | A frail 85-year-old who declines a colonoscopy, valuing quality of life over screening benefit |
What EBM Is — and Is Not
| EBM Is | EBM Is Not |
|---|---|
| An explicit method for using evidence in decisions | Cookbook medicine or rigid protocols |
| Integration of evidence, expertise, and values | Evidence replacing clinical judgment |
| Acknowledgment of uncertainty | A guarantee of the right answer |
| A lifelong learning framework | A one-time memorized fact set |
| Useful at the bedside in real time | Only for researchers or academics |
| A tool for shared decision-making | A cost-containment ploy |
03 EBM vs Traditional Medicine
Traditional (pre-EBM) medical practice was dominated by eminence-based decisions — senior authorities in a field determined standards of care, often based on pathophysiologic reasoning or uncontrolled clinical experience. While valuable, this approach produced and perpetuated many practices later shown to be ineffective or harmful.
Historical Examples of Evidence Overturning Authority
| Intervention | Initial Rationale | What Evidence Showed |
|---|---|---|
| Lidocaine prophylaxis post-MI | Suppress ventricular ectopy, prevent sudden death | RCTs showed increased mortality; abandoned |
| Class I antiarrhythmics (CAST trial, 1989) | Suppress PVCs after MI | >2-fold increase in mortality; established surrogate-endpoint fallacy |
| Hormone replacement therapy (WHI, 2002) | Prevent CAD in postmenopausal women | Increased CV events, stroke, breast cancer |
| Routine arthroscopy for knee OA | Mechanical debridement helps | Sham-controlled RCTs showed no benefit |
| Bed rest for low back pain | Rest promotes healing | Worsens outcomes; early mobilization is superior |
| Tight glycemic control in ICU | Hyperglycemia is harmful | NICE-SUGAR: tight control increased mortality |
| High-dose chemo + BMT for breast cancer | Dose-response rationale | No survival benefit; substantial harm |
Pre-EBM vs EBM Decision-Making
| Feature | Traditional / Eminence-Based | Evidence-Based |
|---|---|---|
| Source of knowledge | Authority, pathophysiology, anecdote | Systematically appraised research |
| Handling of uncertainty | Hidden; authority tends to sound certain | Explicit; magnitudes and confidence intervals reported |
| Role of patient values | Often implicit or ignored | Explicit part of decision-making |
| Response to new evidence | Slow; driven by opinion leaders | Systematic updating via living reviews |
| Metric of quality | Experience and reputation | Outcomes and measurable fidelity to best practice |
Why Pathophysiologic Reasoning Alone Fails
Pathophysiologic reasoning is seductive because it is mechanistic and satisfying — if a drug lowers LDL, and high LDL causes atherosclerosis, then lowering LDL should prevent heart attacks. This chain of reasoning is correct for statins but wrong for torcetrapib, ezetimibe (initially), and many niacin trials, where LDL or HDL changes did not translate to outcome benefits. The body is a complex system with countless feedback loops, off-target effects, and unanticipated interactions. Only empirical testing in humans with patient-important outcomes can confirm whether a biologically plausible mechanism produces a real clinical benefit.
(1) What is the evidence that this intervention helps — and how certain is it? (2) How large is the benefit relative to the harm, cost, and burden? (3) Does this evidence apply to the patient in front of me? If you cannot answer all three, you are not yet practicing EBM.
04 Step 1 — Ask (PICO/PICOT)
The 5-step EBM cycle begins with transforming a clinical information need into an answerable question. A well-constructed question is the foundation of an efficient literature search and a relevant appraisal. The most widely used framework is PICO (sometimes extended to PICOT or PICOS).
The PICO(T) Framework
| Letter | Component | Example |
|---|---|---|
| P | Patient / Population / Problem | Adults with type 2 diabetes and CKD stage 3 |
| I | Intervention / Exposure / Test | SGLT2 inhibitor (empagliflozin) |
| C | Comparison | Placebo or standard care |
| O | Outcome | Progression to ESRD, all-cause mortality |
| T | Time horizon (optional) | Over 3 years of follow-up |
| S | Study type (optional) | Randomized controlled trial or meta-analysis |
Unstructured: “Does aspirin help older patients?” → unanswerable.
PICOT: In adults ≥70 without prior CVD (P), does daily low-dose aspirin (I) compared with placebo (C) reduce cardiovascular death or major bleeding (O) over 5 years (T)? → answerable by the ASPREE trial.
Foreground vs Background Questions
Clinicians ask two fundamentally different types of questions:
- Background questions seek general knowledge about a condition or intervention (“What causes atrial fibrillation?”). These are best answered by textbooks, review articles, or point-of-care resources (UpToDate, DynaMed).
- Foreground questions seek specific evidence to guide a clinical decision (“In patients with new-onset AF, does rhythm control with catheter ablation improve mortality compared to rate control?”). These demand systematic literature searches and critical appraisal.
05 Types of Clinical Questions
Different types of clinical questions demand different study designs for their answer. Recognizing the question type determines where to look and how to appraise what you find.
The Five Major Question Types
| Question Type | What It Asks | Best Study Design | Example |
|---|---|---|---|
| Therapy | Does treatment X help? | RCT / SR of RCTs | Does finerenone reduce CV events in diabetic kidney disease? |
| Diagnosis | How accurate is this test? | Cross-sectional study comparing test to gold standard | What is the sensitivity of high-sensitivity troponin for MI at 1 hour? |
| Prognosis | What is the likely course? | Prospective cohort | What is the 10-year mortality after first stroke? |
| Harm / Etiology | Does this exposure cause harm? | Cohort or case-control | Do fluoroquinolones cause aortic dissection? |
| Prevention | Can we prevent the outcome? | RCT or cohort | Does HPV vaccination prevent cervical cancer? |
Less Common but Important Question Types
| Type | Best Design |
|---|---|
| Screening | RCT with mortality as outcome (ideal) |
| Cost-effectiveness | Economic analysis / decision model |
| Quality improvement | Interrupted time series, stepped-wedge trial |
| Qualitative (patient experience) | Qualitative research (interviews, ethnography) |
| Clinical prediction rule | Derivation and validation cohort studies |
06 Steps 2–5 — Acquire, Appraise, Apply, Assess
Once the question is framed, the remaining steps of the EBM cycle turn evidence into action and feed back into improved practice.
The Full 5-Step EBM Cycle
| Step | Activity | Key Tools |
|---|---|---|
| 1. Ask | Convert information need into an answerable question | PICO/PICOT framework |
| 2. Acquire | Efficiently track down the best evidence | PubMed, Cochrane, UpToDate, DynaMed |
| 3. Appraise | Critically evaluate the evidence for validity, impact, and applicability | JAMA Users’ Guides, CASP checklists, GRADE |
| 4. Apply | Integrate evidence with clinical expertise and patient values | Decision aids, shared decision-making |
| 5. Assess | Evaluate performance and seek ways to improve | Audit, reflection, QI metrics |
A common mnemonic: Ask → Acquire → Appraise → Apply → Assess. Each step can fail independently: a poorly framed question, a bad search, a superficial appraisal, failure to apply evidence to a specific patient, or absence of feedback all undermine EBM practice.
Time Constraints at the Point of Care
A complete 5-step cycle — formulating a question, searching, appraising, and applying — takes hours and is impractical during a busy clinic. For real-time decisions, clinicians rely on pre-appraised resources (Cochrane reviews, UpToDate, DynaMed, BMJ Best Practice), which summarize evidence in structured, regularly updated formats. The full 5-step process is reserved for challenging questions, teaching, or when pre-appraised summaries are unavailable.
07 Databases & Point-of-Care Resources
Knowing which database to search is as important as knowing how to search it. Resources differ in scope, filtering, and the degree to which evidence has already been appraised.
Major Biomedical Databases
| Database | Scope | Notes |
|---|---|---|
| PubMed | Free interface to MEDLINE + PubMed Central + NCBI books | ~35 million citations; default starting point |
| MEDLINE | NLM’s core biomedical database (5,200+ journals) | Indexed with MeSH headings; subset of PubMed |
| Embase | Elsevier; heavier European and pharmacology coverage | Better for adverse drug reactions, device studies; indexed with EMTREE |
| Cochrane Library | Systematic reviews (CDSR) + trials registry (CENTRAL) | Gold standard for SRs; critical for therapy questions |
| CINAHL | Nursing and allied health | Useful for patient experience, nursing interventions |
| PsycINFO | Psychology / behavioral health | Essential for mental health topics |
| Web of Science / Scopus | Multidisciplinary citation indices | Citation tracking (“cited by”) |
Pre-Appraised & Point-of-Care Resources
| Resource | What It Provides | Strengths / Weaknesses |
|---|---|---|
| UpToDate | Expert-authored topic reviews, graded recommendations | Comprehensive, frequently updated; expert summaries may lag or reflect opinion |
| DynaMed | Evidence-graded topic summaries | More explicit evidence grades; some users find less readable |
| BMJ Best Practice | Structured diagnosis-to-treatment summaries | Strong integration of guidelines |
| Cochrane Clinical Answers | Short summaries of Cochrane SRs | Quick point-of-care use |
| NICE / USPSTF / guidelines.gov archives | National clinical guidelines | Varying methodologic rigor |
| ACP Journal Club / EvidenceAlerts | Pre-appraised alerts of new high-quality studies | Keeps clinicians current |
Gray Literature
“Gray literature” includes conference abstracts, theses, regulatory documents (FDA, EMA), unpublished trials, preprints (medRxiv, bioRxiv), and clinical trial registries (ClinicalTrials.gov, WHO ICTRP, EU Clinical Trials Register). It is essential for comprehensive systematic reviews because positive results are preferentially published — ignoring gray literature can bias conclusions.
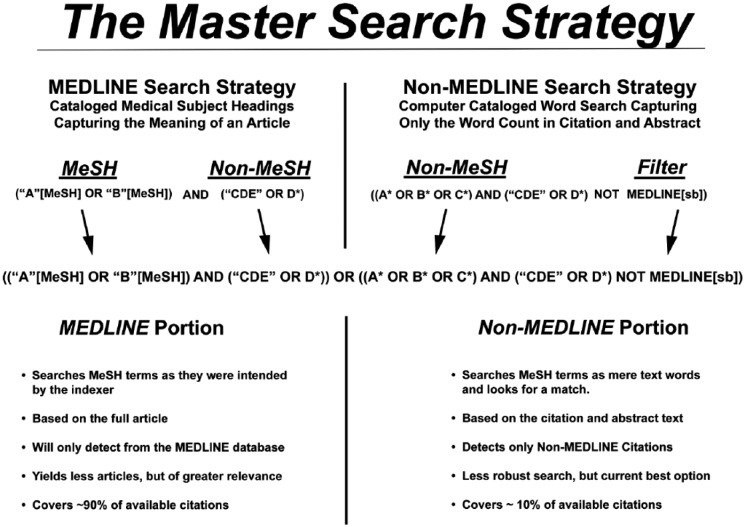
08 Search Strategy, Boolean Logic & MeSH
Efficient searching combines controlled vocabulary (MeSH), free-text terms, Boolean operators, and filters. A good strategy balances sensitivity (capturing all relevant studies) with specificity (excluding irrelevant ones).
Boolean Operators
| Operator | Effect | Example |
|---|---|---|
| AND | Both terms required → narrows results | diabetes AND metformin |
| OR | Either term acceptable → broadens results | “myocardial infarction” OR “heart attack” |
| NOT | Excludes a term → narrows but may lose relevant studies | hypertension NOT pregnancy |
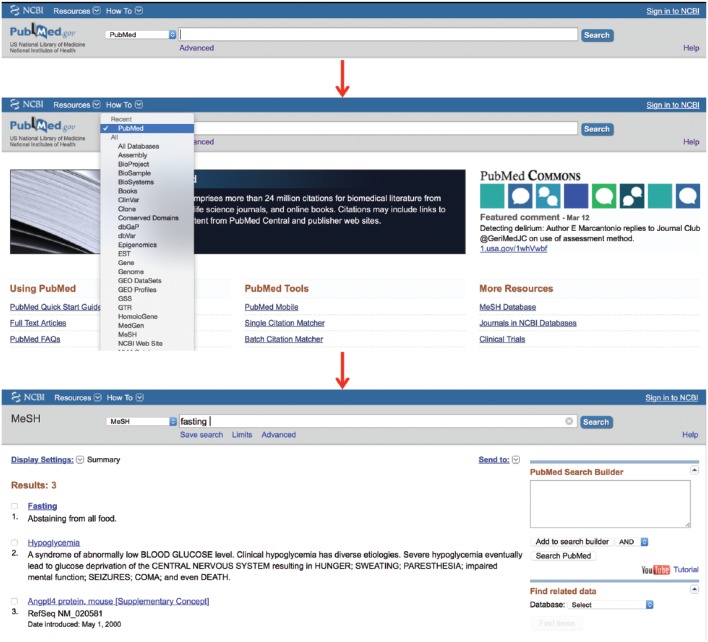
MeSH (Medical Subject Headings)
MeSH is the National Library of Medicine’s controlled vocabulary. Each MEDLINE-indexed article is tagged with MeSH terms by human indexers, allowing retrieval of articles on a concept regardless of exact wording. Searching “myocardial infarction”[MeSH] captures papers that say “heart attack,” “MI,” or “STEMI” without having to list every synonym.
Combine MeSH and free-text: (“Myocardial Infarction”[MeSH] OR “heart attack”[tiab]) AND (“Aspirin”[MeSH] OR aspirin[tiab]). MeSH catches indexed articles; free-text catches recent articles not yet indexed and those missed by indexers.
Useful PubMed Filters
| Filter | Use |
|---|---|
| Article type: Randomized Controlled Trial | Therapy questions |
| Article type: Systematic Review / Meta-Analysis | Synthesized evidence |
| Article type: Practice Guideline | Current recommendations |
| Species: Humans | Exclude animal studies |
| Age group, sex | Population-specific questions |
| Publication date | Recent evidence |
| Clinical Queries filter | Pre-built methodologic filters by question type |
Four-Step Search Strategy
- Identify concepts using PICO.
- Find MeSH terms and synonyms for each concept.
- Combine synonyms with OR, then concepts with AND.
- Apply limits (study type, date, language) appropriate to the question.
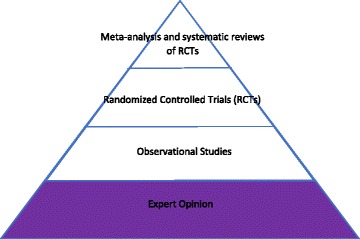
09 The Evidence Pyramid
Not all evidence is created equal. The evidence pyramid visualizes a rough hierarchy of study designs by their ability to reduce bias in estimating treatment effects. Higher-tier designs are more likely (on average) to provide valid estimates, but a well-done cohort can outperform a flawed RCT.
Classic Evidence Pyramid (Unfiltered Information)
| Level | Study Type | Key Feature |
|---|---|---|
| Top | Systematic reviews / meta-analyses of RCTs | Synthesize all available trials |
| 2 | Randomized controlled trials (RCTs) | Randomization balances confounders |
| 3 | Cohort studies (prospective > retrospective) | Follow exposed vs unexposed forward in time |
| 4 | Case-control studies | Compare cases with outcome to controls without |
| 5 | Cross-sectional studies | Snapshot of exposure and outcome |
| 6 | Case series / case reports | Descriptive; generate hypotheses |
| Bottom | Expert opinion / bench research | Mechanism, pathophysiology, speculation |
Haynes “5S” / “6S” Pyramid (Pre-Appraised Information)
Brian Haynes proposed an alternative hierarchy focused on how the evidence reaches the clinician, prioritizing pre-appraised sources that save time at the bedside:
| Level | Type | Example |
|---|---|---|
| Systems | Computerized decision support linked to the EHR | Alerts, order sets with embedded evidence |
| Summaries | Evidence-based topic reviews | UpToDate, DynaMed, BMJ Best Practice |
| Synopses of Syntheses | Structured abstracts of SRs | Cochrane Clinical Answers, DARE |
| Syntheses | Systematic reviews and meta-analyses | Cochrane Reviews |
| Synopses of Studies | Structured abstracts of individual studies | ACP Journal Club |
| Studies | Individual primary studies | Original RCTs and cohorts |
Systematic Review vs Meta-Analysis — The Critical Distinction
These terms are often confused:
- A systematic review (SR) is a structured, reproducible summary of all the evidence relevant to a focused question, using explicit methods to search, select, and appraise studies.
- A meta-analysis (MA) is a statistical technique that quantitatively pools results from multiple studies into a single summary estimate.
- All meta-analyses should be embedded in a systematic review. Not all systematic reviews include a meta-analysis — when studies are too heterogeneous to pool, a qualitative (narrative) synthesis is appropriate.
10 Study Designs Overview
The choice of study design is driven by the question and by ethical and practical constraints. This section summarizes the major designs and when to use each.
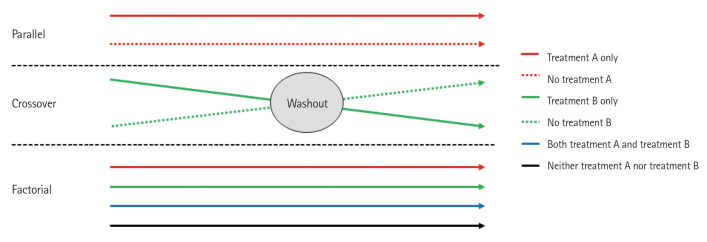
Experimental Designs
| Design | Key Feature | Strength | Weakness |
|---|---|---|---|
| Parallel-group RCT | Random assignment to arms | Minimizes confounding; gold standard for therapy | Cost; limited generalizability |
| Crossover RCT | Each participant receives both interventions | Smaller sample, within-subject comparison | Carryover effects; only for stable chronic conditions |
| Cluster RCT | Randomize groups (e.g., clinics) | Used for systems/population interventions | Reduced power; design effect from clustering |
| Factorial RCT | Tests 2+ interventions simultaneously | Efficient for independent interventions | Interaction effects complicate analysis |
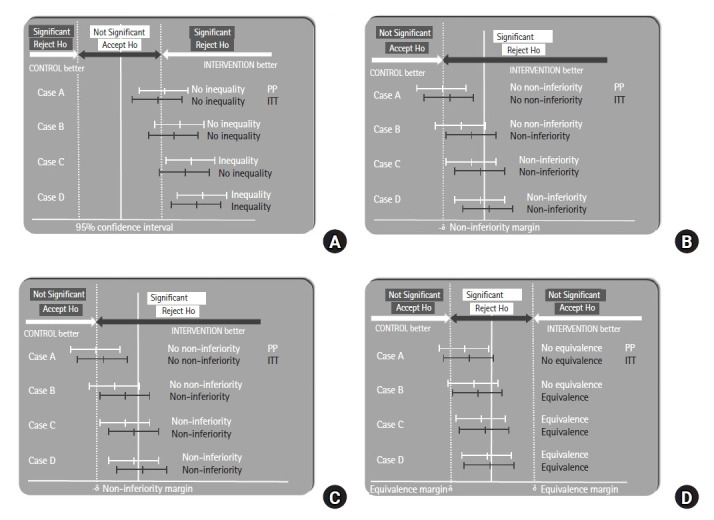
| Non-inferiority RCT | New treatment is not worse than standard by a pre-set margin | Useful when equipoise exists | Margin choice is critical and often controversial |
| Adaptive trial | Pre-specified modifications based on interim results | Efficient; platform trials (RECOVERY) | Complex statistical adjustments |
| N-of-1 trial | Single patient, multiple crossover periods | Individualized evidence | Not generalizable |
Observational Designs
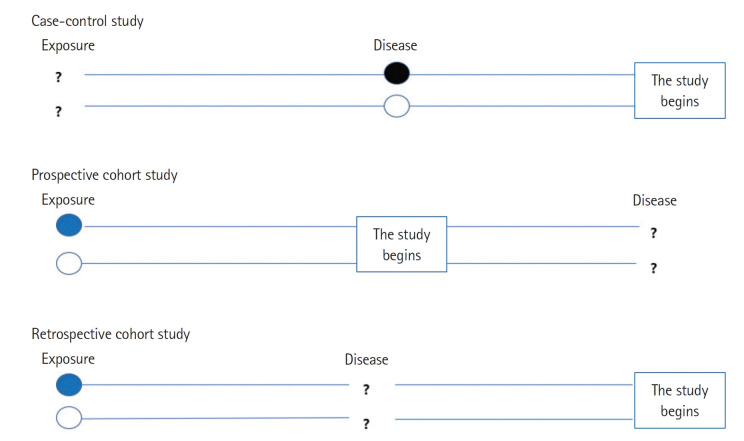
| Design | Direction | Best For | Caveats |
|---|---|---|---|
| Prospective cohort | Exposure → outcome (forward) | Prognosis; rare exposure; multiple outcomes | Long follow-up, loss to follow-up |
| Retrospective cohort | Exposure → outcome (historical) | Faster; occupational harms | Records quality; missing data |
| Case-control | Outcome → exposure (backward) | Rare outcomes; etiology | Recall bias; cannot calculate incidence |
| Cross-sectional | Both at one time point | Prevalence; diagnostic accuracy | Cannot establish temporality |
| Ecological | Population-level | Hypothesis generation | Ecological fallacy |
| Case series / report | Descriptive | Rare diseases, novel presentations | No comparison; no inference |
Quasi-Experimental Designs
When randomization is impossible (policy changes, system interventions), quasi-experimental designs provide stronger inference than simple before-after comparisons:
| Design | Description | Use |
|---|---|---|
| Interrupted time series | Multiple measurements before and after an intervention | Policy changes, hand-hygiene campaigns |
| Difference-in-differences | Compares change in treated vs untreated groups over time | Health policy; Medicaid expansion studies |
| Regression discontinuity | Exploits a threshold-based intervention | Eligibility thresholds (e.g., age 65 for Medicare) |
| Instrumental variable analysis | Uses a variable correlated with exposure but not outcome except through exposure | Mendelian randomization; geographic variation |
| Stepped-wedge cluster trial | All clusters eventually get the intervention, at staggered start times | Implementation trials |
Key Concepts in Observational Analysis
| Concept | Meaning |
|---|---|
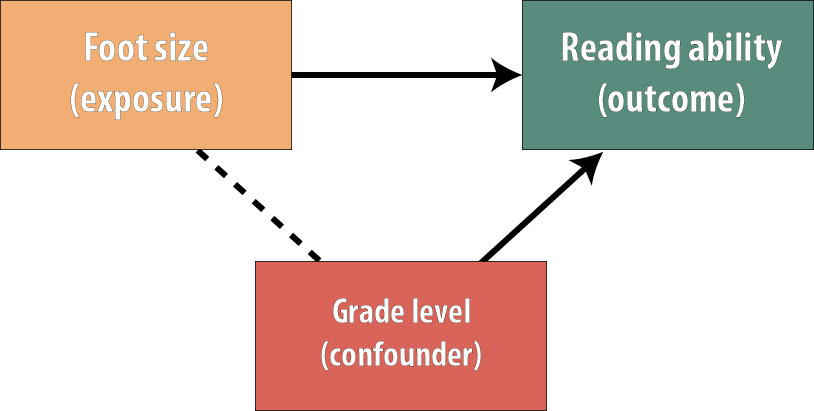
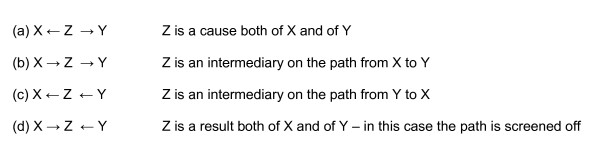
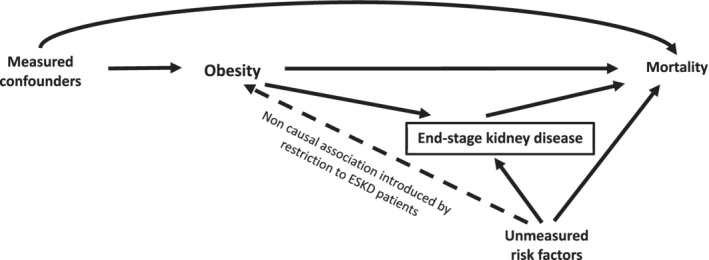
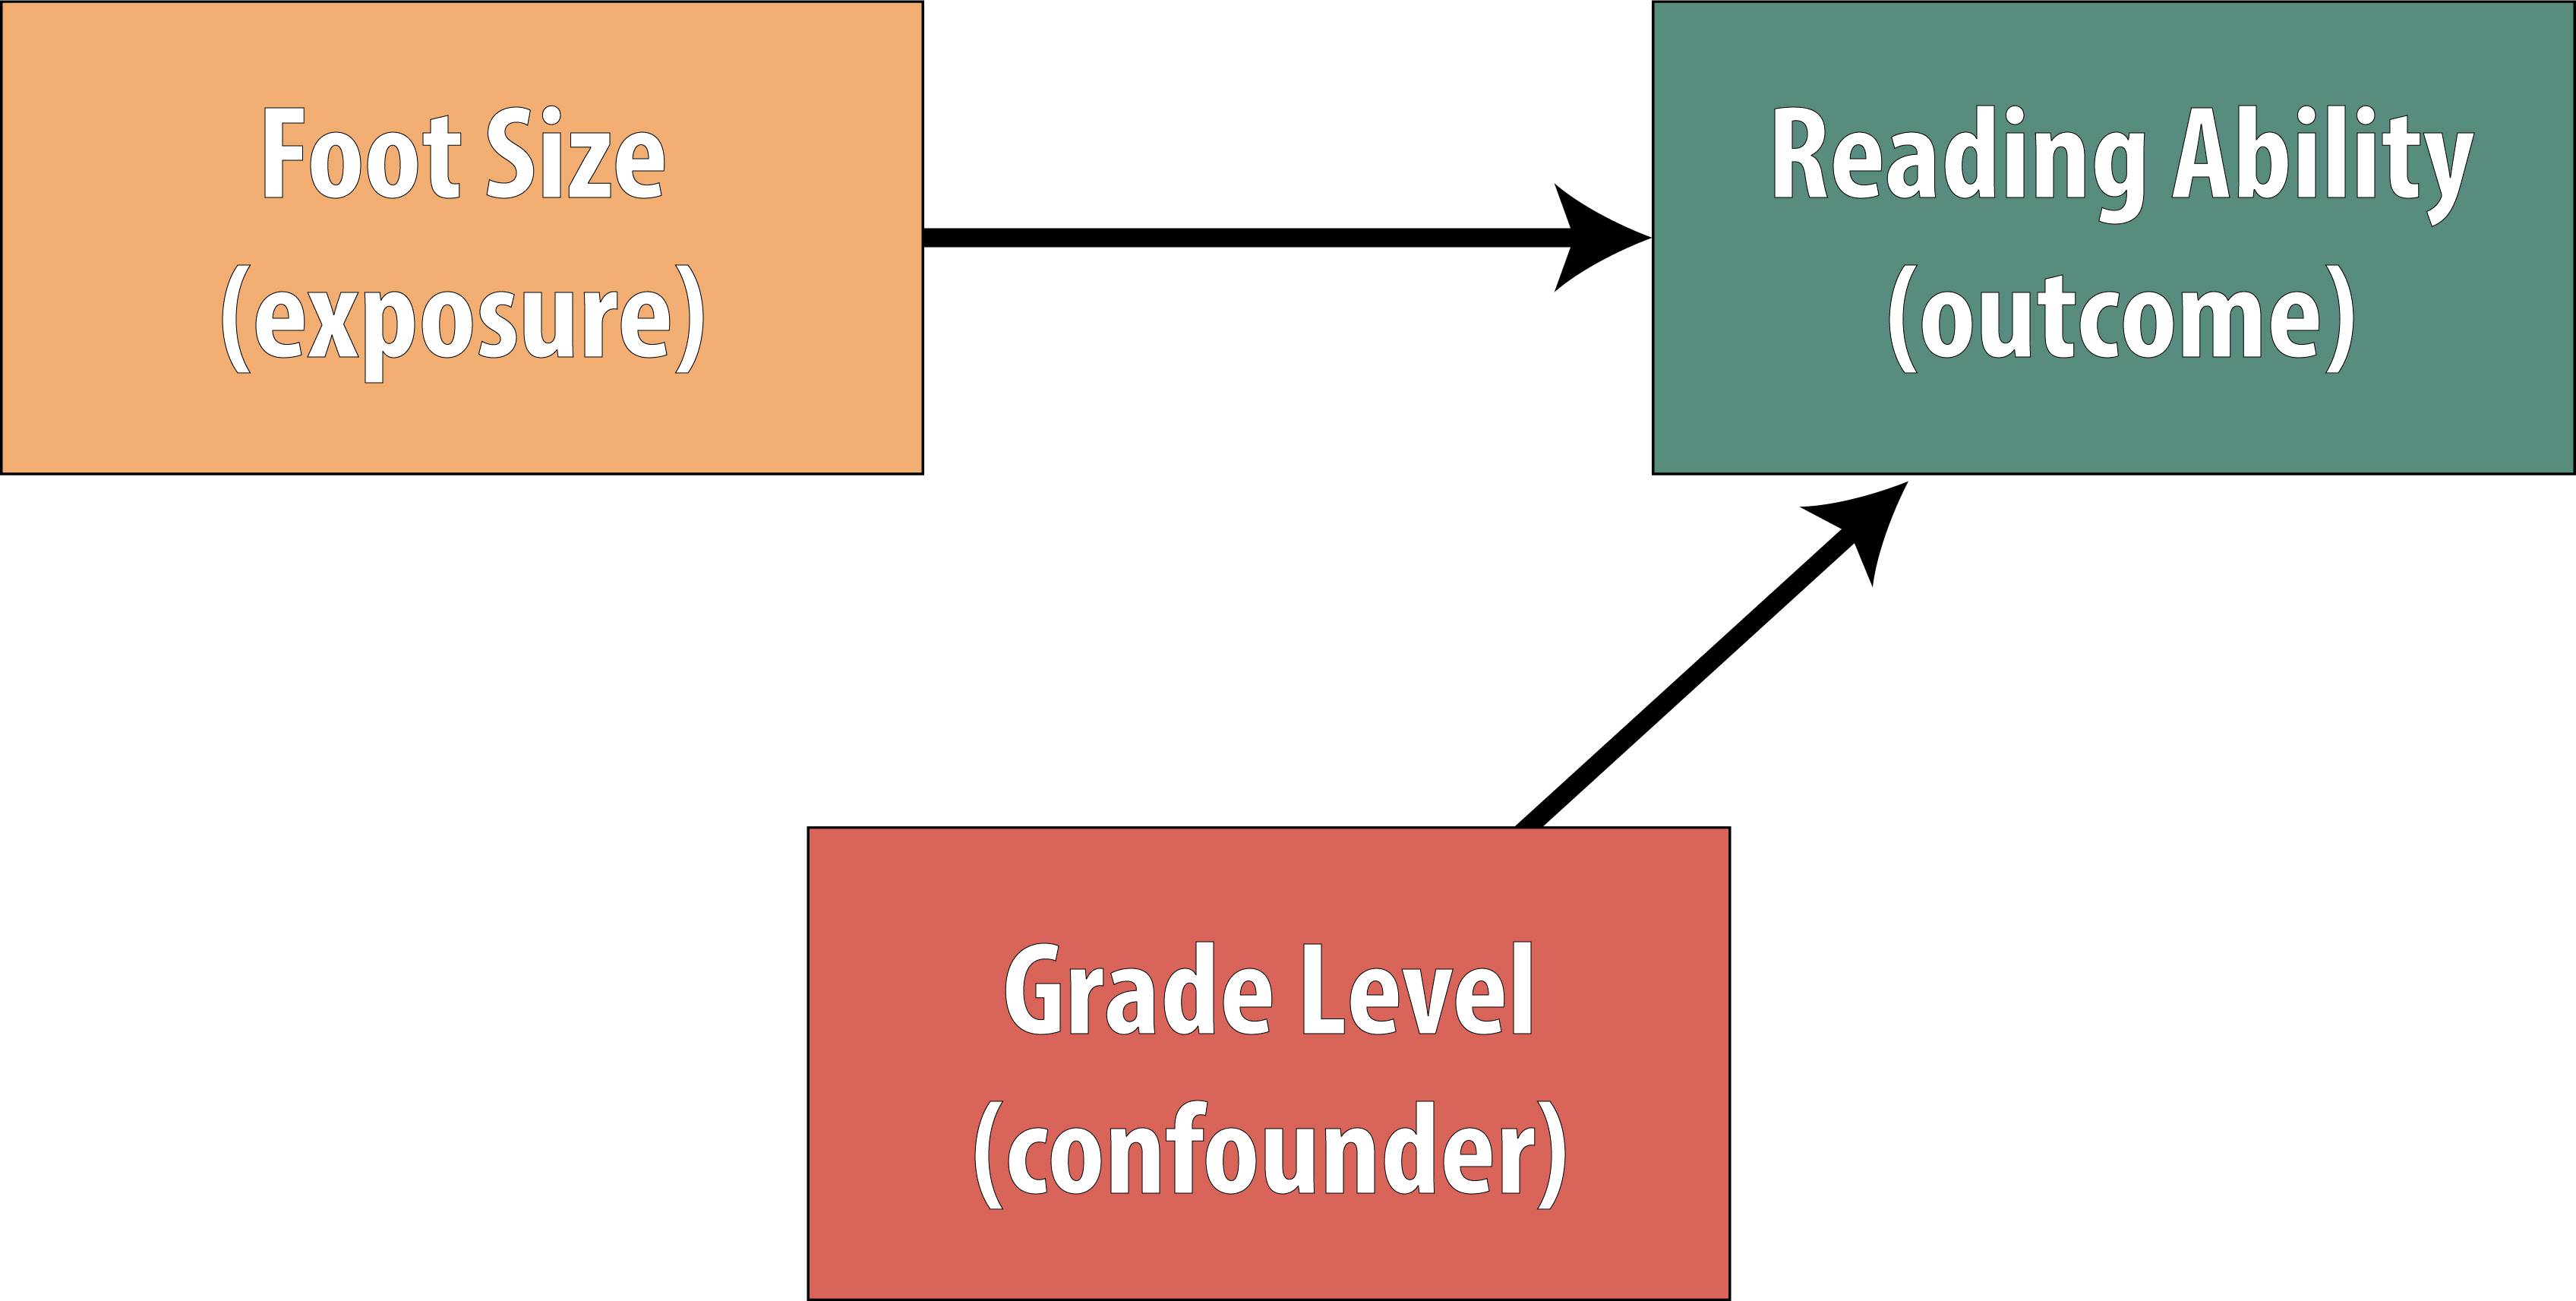
| Confounding | A third variable associated with both exposure and outcome distorts the apparent relationship |
| Confounding by indication | The reason a drug is prescribed is itself associated with the outcome |
| Propensity score matching | Balances observational groups on measured covariates to mimic randomization |
| Effect modification | The effect differs across subgroups — a real phenomenon, not bias |
| Healthy-user bias | Users of an intervention tend to be healthier overall, inflating apparent benefit |
| Immortal time bias | Period during which outcome cannot occur is misclassified |
11 Validity of RCTs
Critical appraisal of a therapy study asks three core questions: (1) Are the results valid? (2) What are the results? (3) Will they help me care for my patient? This section focuses on validity — whether the study design protects against bias.
Key Validity Criteria for RCTs
| Criterion | Why It Matters |
|---|---|
| Randomization | Balances known and unknown confounders between arms |
| Allocation concealment | Prevents the enroller from manipulating who gets which arm (e.g., sealed opaque envelopes, central randomization) |
| Blinding (masking) | Minimizes performance bias (caregivers) and ascertainment bias (outcome assessors) |
| Groups similar at baseline | Confirms that randomization succeeded (Table 1 of the paper) |
| Co-interventions equal | Prevents confounding by differential treatment outside the protocol |
| Complete follow-up | <5% loss is reassuring; >20% threatens validity (“5 and 20 rule”) |
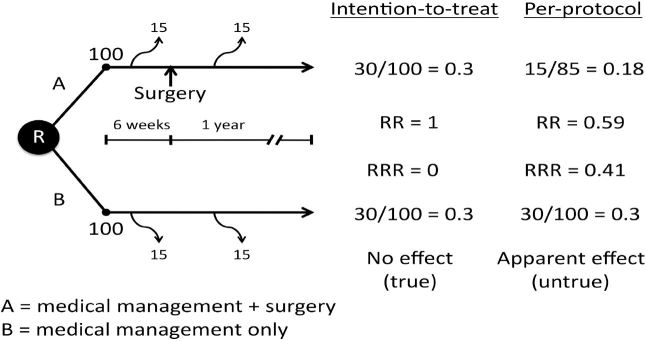
| Intention-to-treat (ITT) analysis | Analyzes patients in their originally assigned groups regardless of adherence; preserves randomization |
Randomization vs Allocation Concealment
These are distinct concepts: randomization is the process of generating a random sequence; allocation concealment is hiding that sequence from the person enrolling participants. Studies with inadequate allocation concealment overestimate treatment effects by ~30–40%.
Levels of Blinding
| Type | Who Is Blinded | Protects Against |
|---|---|---|
| Single-blind | Usually participant | Placebo/nocebo effects |
| Double-blind | Participant + caregiver | Performance bias |
| Triple-blind | Participant + caregiver + outcome assessor | Ascertainment bias |
| Quadruple-blind | + data analyst | Analytic bias |
Intention-to-Treat vs Per-Protocol
| Analysis | Definition | Use |
|---|---|---|
| ITT | Analyze everyone in the group to which they were randomized | Preferred for superiority trials; conservative estimate of effect |
| Per-protocol | Analyze only those who completed the protocol as assigned | Sensitivity analysis; preferred for non-inferiority (more conservative in that context) |
| As-treated | Analyze by the treatment actually received | Rarely preferred; breaks randomization |
Selection bias (non-random assignment) → prevented by randomization + concealment.
Performance bias (differential care) → prevented by blinding.
Attrition bias (differential dropouts) → minimized by complete follow-up and ITT.
Detection bias (differential outcome ascertainment) → prevented by blinded assessors.
Reporting bias (selective outcome reporting) → detected via pre-registered protocols.
Methods of Randomization
| Method | Description | Strengths / Weaknesses |
|---|---|---|
| Simple randomization | Each participant randomized independently | Easy; can give unequal group sizes in small trials |
| Block randomization | Randomization within fixed-size blocks | Guarantees balance; block size must be hidden |
| Stratified randomization | Separate sequences for key prognostic strata | Balances important confounders |
| Minimization | Dynamic allocation to balance covariates | Good for small trials; semi-random |
| Cluster randomization | Groups (clinics, wards) randomized rather than individuals | Avoids contamination; needs design-effect adjustment |
When an RCT Is Not Possible
Randomized trials are sometimes impossible or unethical (rare diseases, emergency conditions, long-term exposures, harms). In such cases, observational evidence must carry the inference. Key strategies to strengthen observational inference include large sample sizes, propensity score methods, instrumental variable analysis, negative controls, target trial emulation, and triangulation across independent designs.
12 Results — Effect Size, RR, ARR, NNT, CI
Once validity is established, the next appraisal question is: how large is the effect, and how precise is the estimate? Effect size measures quantify the impact; confidence intervals quantify precision.
Core Effect Measures (Dichotomous Outcomes)
| Measure | Formula | Interpretation |
|---|---|---|
| Control event rate (CER) | Events in control / control n | Baseline risk |
| Experimental event rate (EER) | Events in treatment / treatment n | Risk on treatment |
| Absolute risk reduction (ARR) | CER − EER | Real-world benefit; drives NNT |
| Relative risk (RR) | EER / CER | Ratio of risks; <1 = protective |
| Relative risk reduction (RRR) | (CER − EER) / CER = 1 − RR | Proportion of baseline risk removed |
| Odds ratio (OR) | Odds in treatment / odds in control | Approximates RR when outcome is rare |
| Number needed to treat (NNT) | 1 / ARR | Patients to treat to prevent one event |
| Number needed to harm (NNH) | 1 / ARI | Patients treated to cause one harm |
| Hazard ratio (HR) | From Cox regression | Relative hazard over time |
A statin reduces 5-year MI rate from 10% (CER) to 7% (EER). ARR = 0.03; RRR = 0.30 (30%); NNT = 1/0.03 ≈ 33. You must treat about 33 patients for 5 years to prevent one MI. The same RRR of 30% applied to a baseline risk of 1% gives an NNT of 333 — identical relative effect, very different clinical meaning.
Why RRR Alone Is Misleading
Press releases love relative risk reductions because they sound larger (“30% reduction”) than absolute numbers (“3 fewer events per 100 patients”). Always translate relative figures into absolute ones. A large RRR applied to a very low baseline risk yields a small ARR and a large NNT, which may not justify the cost or side effects.
Confidence Intervals & Statistical Significance
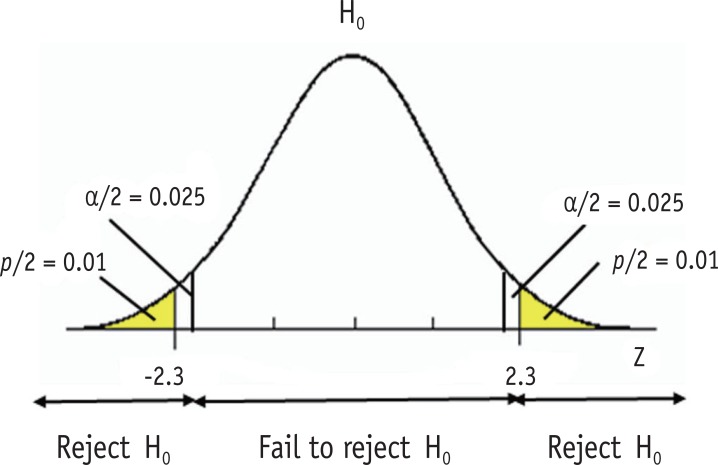
A 95% confidence interval (CI) is the range within which the true effect likely lies, repeated across hypothetical studies. If the CI for an RR or OR crosses 1.0 (or the CI for a mean difference crosses 0), the result is not statistically significant at α = 0.05. The width of the CI reflects precision — wider = less precise, narrower = more precise.
| Concept | Rule |
|---|---|
| CI for RR/OR includes 1.0 | Not statistically significant |
| CI for mean difference includes 0 | Not statistically significant |
| Narrow CI | Precise estimate (often large sample) |
| Wide CI | Imprecise (small sample or rare outcome) |
| p-value < 0.05 | Conventionally “significant” but must be interpreted in context |
Statistical vs Clinical Significance
A statistically significant result may be clinically trivial (e.g., a 2 mmHg blood pressure difference from a huge trial), and a non-significant result may hide a clinically important effect obscured by low power. Always ask: is this difference big enough to matter to a patient?
Types of Outcomes in Trials
| Outcome Type | Example | Consideration |
|---|---|---|
| Patient-important (hard) | Death, MI, stroke, hospitalization | Primary evidence of benefit |
| Patient-reported | Pain, quality of life, function | Requires validated instruments; blinding critical |
| Surrogate | LDL, HbA1c, CD4 count, BP | Must be validated against hard outcomes |
| Composite | MACE (death + MI + stroke) | Valid if components are comparably important and similarly affected |
| Time-to-event | Time to relapse, progression-free survival | Analyzed with Kaplan-Meier and Cox regression |
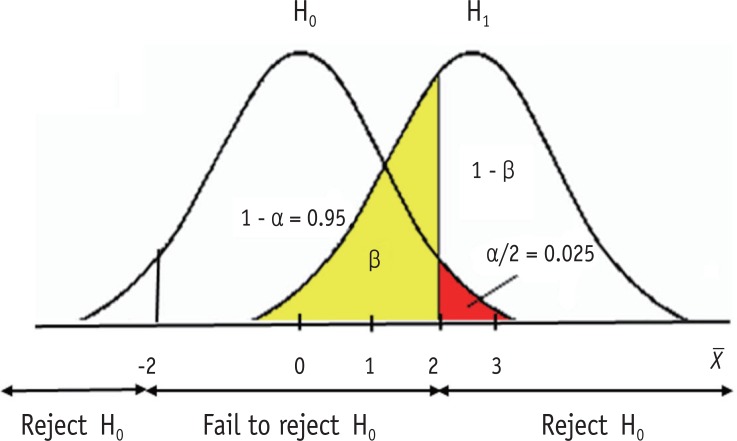
Power & Sample Size
Statistical power (1 − β) is the probability of detecting a true effect of a specified size. Convention requires ≥80% power. Sample size depends on expected effect size, baseline event rate, variability, α (usually 0.05), and desired power. Underpowered trials produce wide confidence intervals and risk missing real effects (type II error); they also produce inflated effect estimates when positive (“winner’s curse”).
13 Applicability & CONSORT
A valid, precise result is useless if it does not apply to your patient. Applicability (external validity, generalizability) asks whether you can extrapolate the study findings to the person in front of you.
Applicability Questions
- Is my patient similar enough to the trial population (age, sex, comorbidities, severity, ethnicity)?
- Was the treatment protocol feasible in my setting?
- Were all clinically important outcomes considered, including harms and quality of life?
- Do the benefits outweigh the harms, costs, and burdens for this patient?
- Are the patient’s values and preferences consistent with the intervention?
Efficacy is the effect of an intervention under ideal, controlled conditions (explanatory trials). Effectiveness is the effect in routine practice (pragmatic trials). Most published RCTs measure efficacy, yet patients live in the effectiveness world — with adherence problems, comorbidities, and resource constraints. Pragmatic trials narrow this gap.
CONSORT — Reporting RCTs
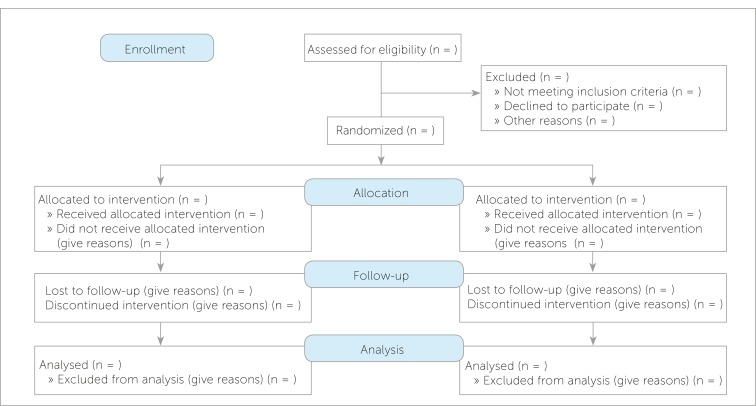
The CONSORT (Consolidated Standards of Reporting Trials) statement is a 25-item checklist and flow diagram for transparent reporting of parallel-group RCTs. Journals increasingly require CONSORT compliance. Key elements include:
| CONSORT Item | What to Report |
|---|---|
| Trial design | Type (parallel, crossover), allocation ratio |
| Randomization | Sequence generation, concealment mechanism, implementation |
| Blinding | Who was blinded and how |
| Participant flow | Enrollment, allocation, follow-up, analysis (CONSORT flow diagram) |
| Baseline data | Demographics and clinical characteristics by group |
| Outcomes and estimation | Primary and secondary outcomes with effect size and precision |
| Harms | All-cause and specific adverse events by group |
| Registration & protocol | Trial registration number and protocol access |
14 Diagnostic Study Validity & Biases
Diagnostic studies evaluate how well a test distinguishes patients with the disease from those without it. Critical appraisal here has its own vocabulary and pitfalls.
Validity Criteria for Diagnostic Studies
| Criterion | Why It Matters |
|---|---|
| Independent, blinded comparison | Test and reference standard interpreted without knowledge of each other |
| Appropriate reference standard | The “gold standard” must truly define disease status |
| Reference standard applied to all | All patients — positive and negative on the index test — get the gold standard |
| Appropriate spectrum | Patients resemble those in whom the test will be used in practice |
| Reproducibility | Clear, reproducible test procedure and thresholds |
Key Biases in Diagnostic Studies
| Bias | Description | Effect |
|---|---|---|
| Spectrum bias | Study enrolls mostly severe cases and healthy controls | Inflates sensitivity and specificity; performance drops in real-world mixed populations |
| Verification bias (work-up bias) | Only patients with a positive index test get the gold standard | Inflates sensitivity, underestimates specificity |
| Review bias | Interpreter of one test knows the result of the other | Inflates apparent accuracy |
| Incorporation bias | The index test is part of the reference standard | Artificially inflates accuracy |
| Disease-progression bias | Delay between index test and reference standard allows disease to change | Misclassification |
15 Sensitivity, Specificity, LRs, ROC, STARD & QUADAS-2
The 2×2 Diagnostic Table
| Disease + | Disease − | |
|---|---|---|
| Test + | True Positive (TP) | False Positive (FP) |
| Test − | False Negative (FN) | True Negative (TN) |
Core Diagnostic Metrics
| Metric | Formula | Interpretation |
|---|---|---|
| Sensitivity (Sn) | TP / (TP + FN) | Probability of a positive test in diseased patients; high Sn rules out (SnNOUT) |
| Specificity (Sp) | TN / (TN + FP) | Probability of a negative test in healthy patients; high Sp rules in (SpPIN) |
| Positive predictive value (PPV) | TP / (TP + FP) | Probability of disease given a positive test; depends on prevalence |
| Negative predictive value (NPV) | TN / (TN + FN) | Probability of no disease given a negative test; depends on prevalence |
| Positive likelihood ratio (LR+) | Sn / (1 − Sp) | >10 strong rule-in; 5–10 moderate |
| Negative likelihood ratio (LR−) | (1 − Sn) / Sp | <0.1 strong rule-out; 0.1–0.2 moderate |
| Accuracy | (TP + TN) / total | Overall correct classification; misleading when prevalence is skewed |
A very Sensitive test, when Negative, rules OUT disease (SnNOUT).
A very Specific test, when Positive, rules IN disease (SpPIN). These mnemonics summarize the test-choice logic for ruling in vs ruling out.
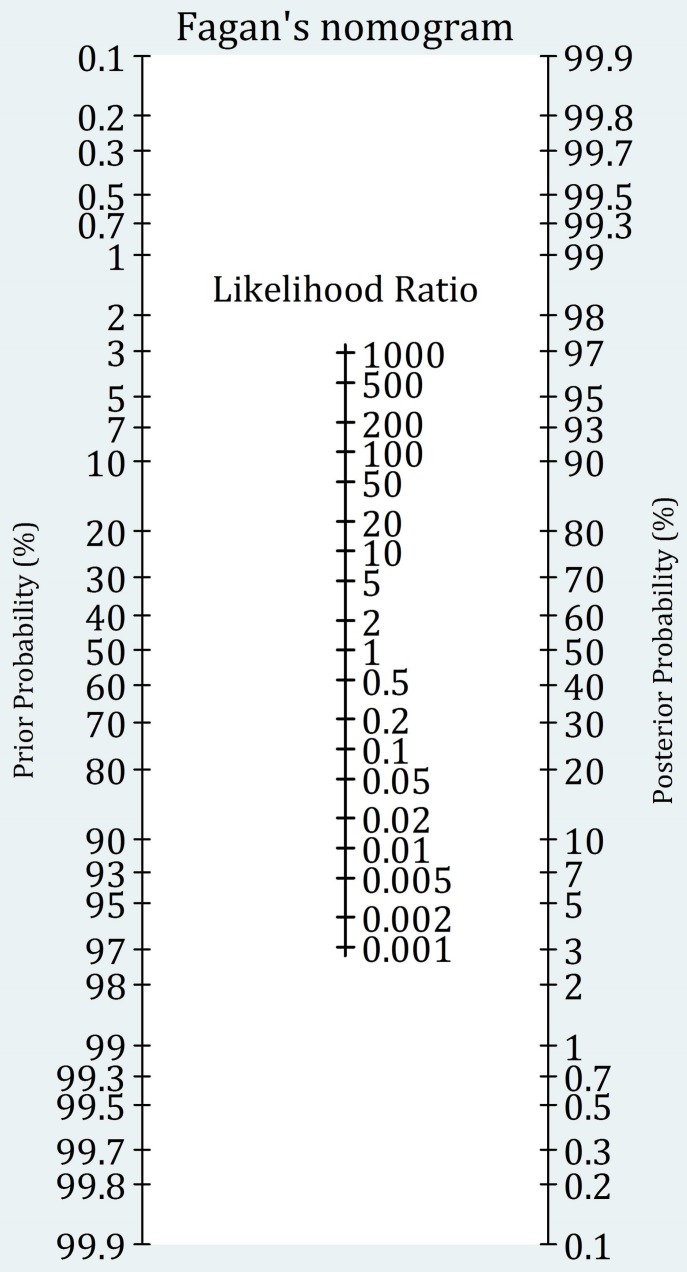
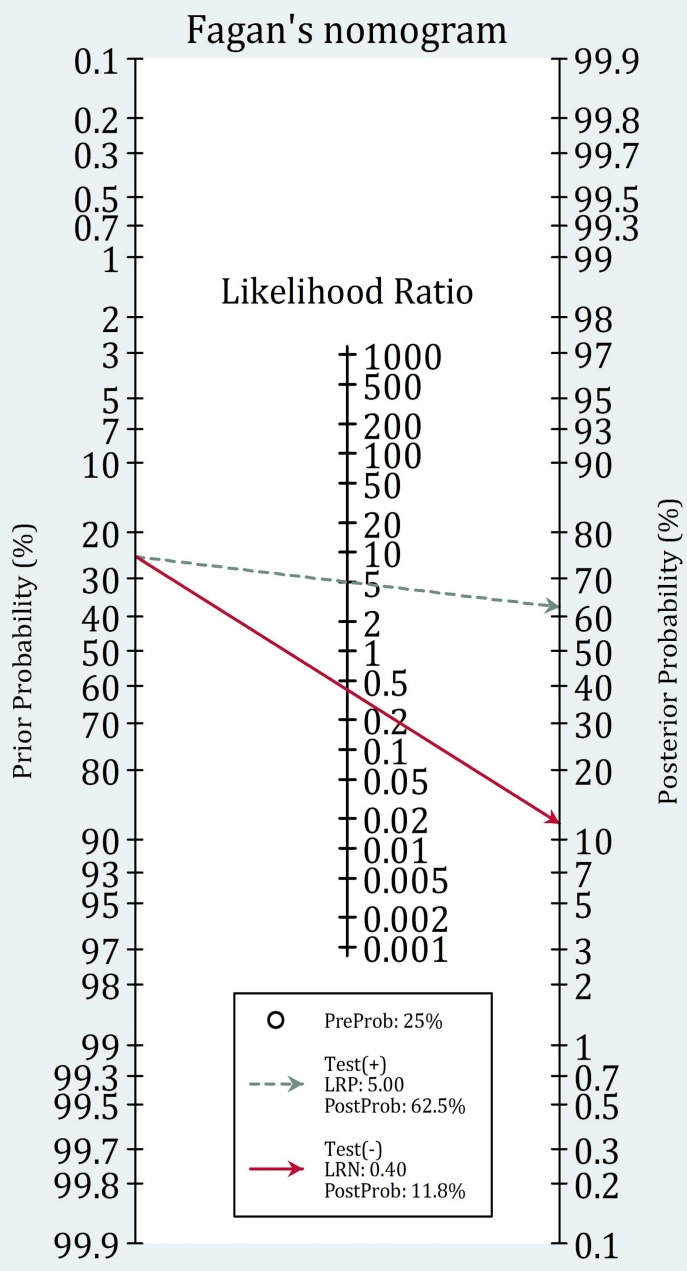
Likelihood Ratios & Bayesian Reasoning
Likelihood ratios convert pre-test probability into post-test probability without requiring the population prevalence. They are the most clinically useful diagnostic metric because they work at the individual patient level.
| LR+ | Approximate Change in Probability |
|---|---|
| >10 | Large, often conclusive increase |
| 5–10 | Moderate increase |
| 2–5 | Small increase |
| 1–2 | Minimal; usually unhelpful |
| 1 | No change |
| LR− | Approximate Change in Probability |
|---|---|
| <0.1 | Large, often conclusive decrease |
| 0.1–0.2 | Moderate decrease |
| 0.2–0.5 | Small decrease |
| 0.5–1 | Minimal; usually unhelpful |
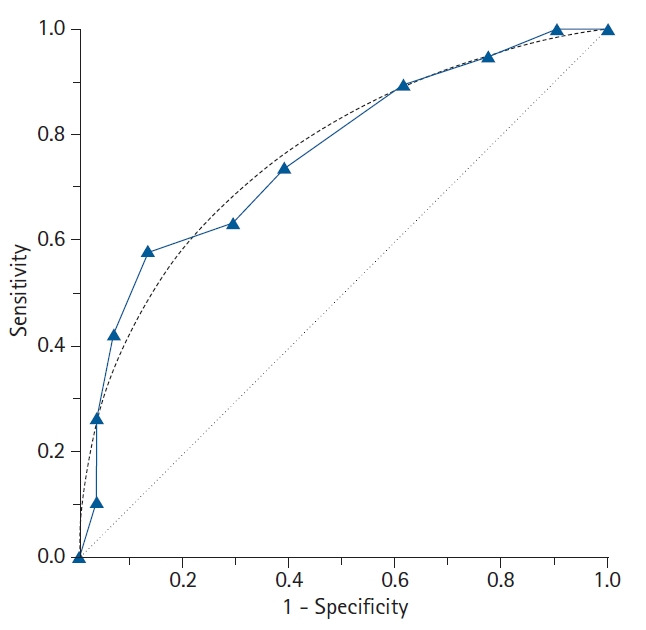
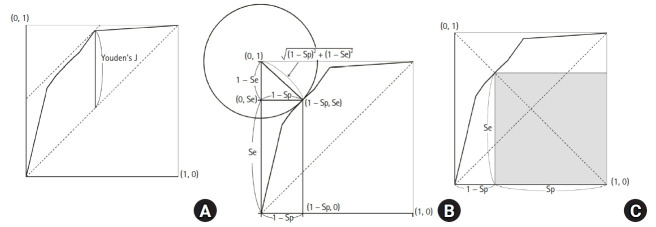
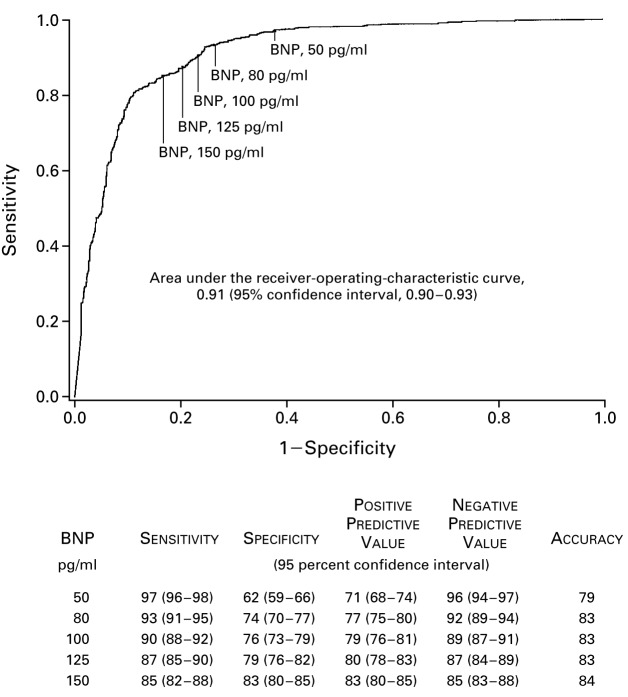
ROC Curves
A receiver operating characteristic (ROC) curve plots sensitivity (y-axis) against 1 − specificity (x-axis) across all possible thresholds for a continuous test. The area under the curve (AUC) summarizes overall discrimination: AUC 0.5 = no better than chance, 0.7–0.8 acceptable, 0.8–0.9 excellent, >0.9 outstanding.
Reporting & Appraisal Tools
| Tool | Purpose |
|---|---|
| STARD | Reporting checklist for diagnostic accuracy studies (analogous to CONSORT for RCTs) |
| QUADAS-2 | Tool to assess risk of bias and applicability in diagnostic studies included in systematic reviews |
| TRIPOD | Reporting of multivariable prediction models (diagnosis and prognosis) |
Worked 2×2 Example
Suppose a troponin assay is tested in 1,000 patients with chest pain. 100 truly have MI (10% prevalence). The test is positive in 95 of the 100 with MI and in 90 of the 900 without MI.
| MI + | MI − | Total | |
|---|---|---|---|
| Test + | TP = 95 | FP = 90 | 185 |
| Test − | FN = 5 | TN = 810 | 815 |
| Total | 100 | 900 | 1000 |
- Sensitivity = 95/100 = 95%
- Specificity = 810/900 = 90%
- PPV = 95/185 = 51%
- NPV = 810/815 = 99.4%
- LR+ = 0.95 / 0.10 = 9.5
- LR− = 0.05 / 0.90 = 0.056
Notice that even with excellent sensitivity and specificity, PPV is only 51% because of the 10% prevalence. If prevalence were 1% (e.g., screening asymptomatic young adults), PPV would fall below 10%.
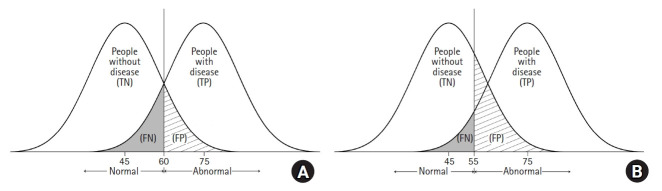
Diagnostic Thresholds & Tradeoffs
Most continuous tests force a tradeoff between sensitivity and specificity via the cutoff. Lower cutoffs raise sensitivity (and NPV) but reduce specificity (and PPV). The optimal threshold depends on the clinical consequence of false negatives vs false positives — missing a pulmonary embolism vs a false-positive CT angiogram involve very different harms. The ROC curve displays every possible tradeoff.
16 Prognosis Studies & Cohort Design
Prognosis studies estimate the likely course of a disease — rate of recovery, progression, complications, death, or functional outcome. They answer questions patients ask most often: “What will happen to me?” The ideal design is a prospective inception cohort with complete follow-up.
Validity Criteria for Prognosis Studies
| Criterion | Why |
|---|---|
| Well-defined inception cohort | All patients assembled at a common early point in disease (e.g., new MI diagnosis) |
| Follow-up sufficiently long and complete | Long enough to capture outcomes; <20% lost to follow-up |
| Objective outcome criteria | Blinded outcome assessment when possible |
| Adjustment for prognostic factors | Confounders controlled through multivariable modeling |
| Validation cohort | Prognostic models should be validated in a separate population |
Sources of Bias in Prognosis Studies
| Bias | Effect |
|---|---|
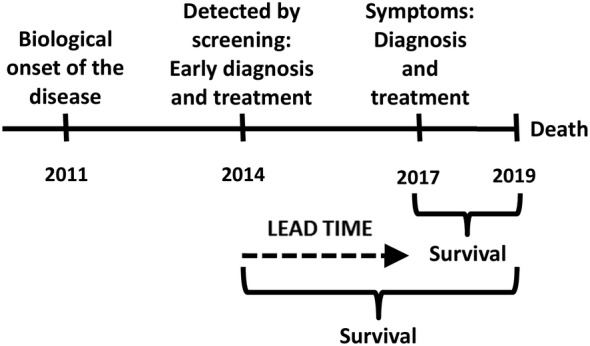
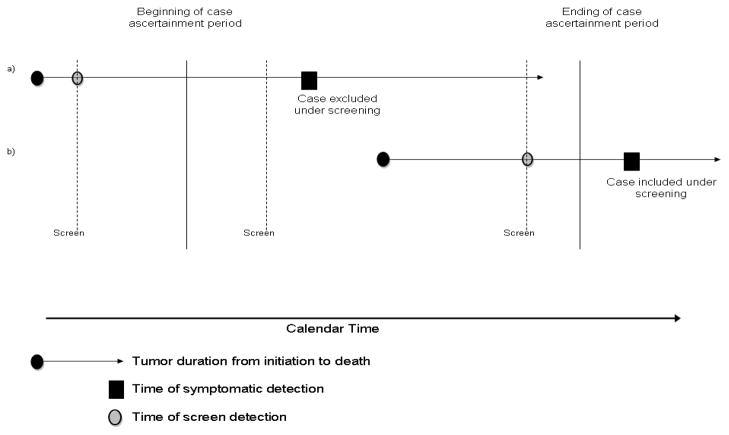
| Lead-time bias | Earlier diagnosis appears to prolong survival without changing disease course |
| Length bias | Screening preferentially detects slow-growing disease, inflating apparent survival |
| Survivor cohort bias | Cohorts assembled late miss patients who died early |
| Loss to follow-up | Lost patients may have different outcomes |
| Will Rogers phenomenon | Improved staging moves patients between categories, improving apparent survival in both |
Reporting Prognostic Results
| Measure | Use |
|---|---|
| Event rate at fixed time | “30-day mortality = 8%” |
| Median survival | Robust summary of time-to-event |
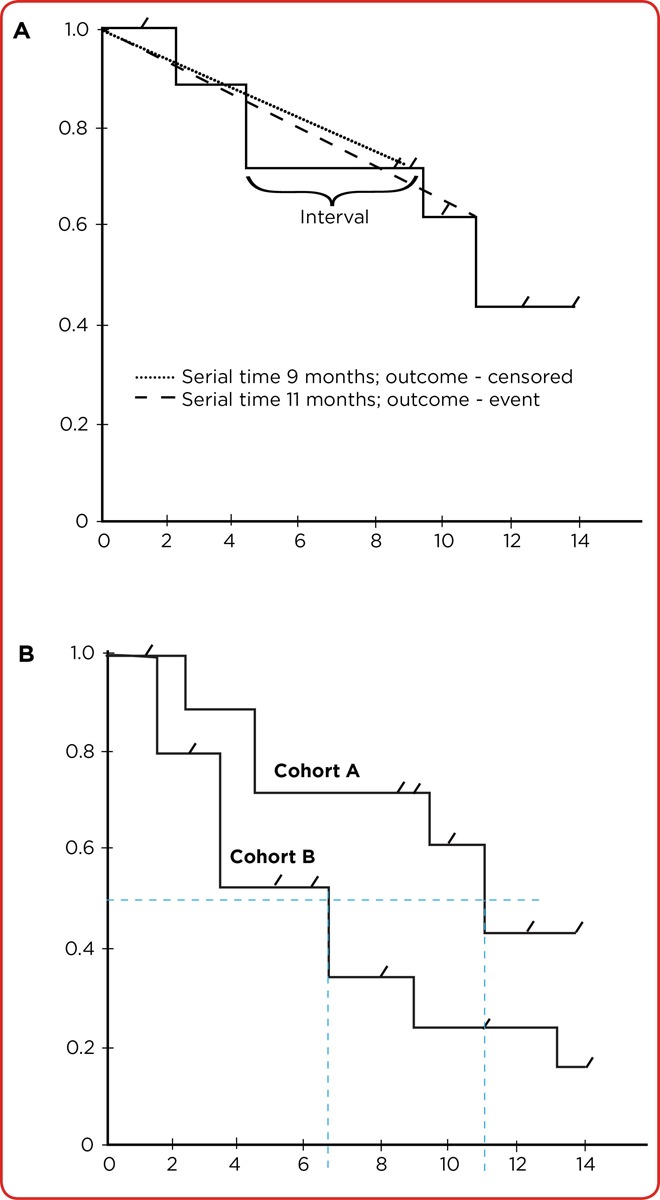
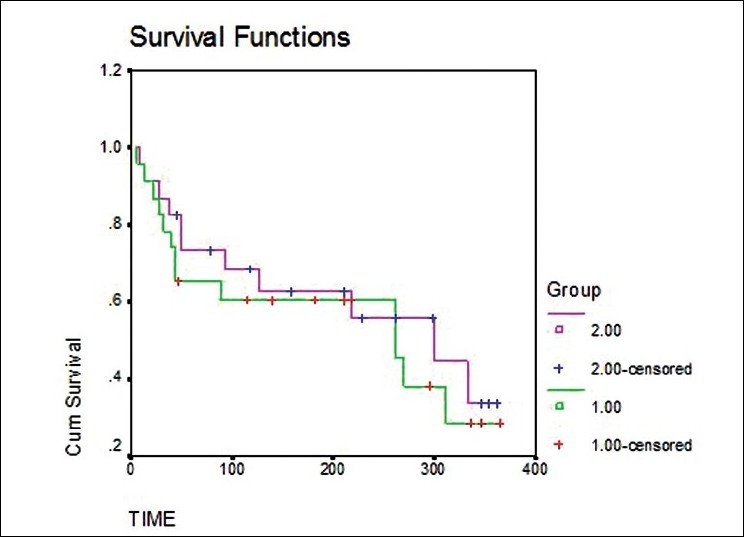
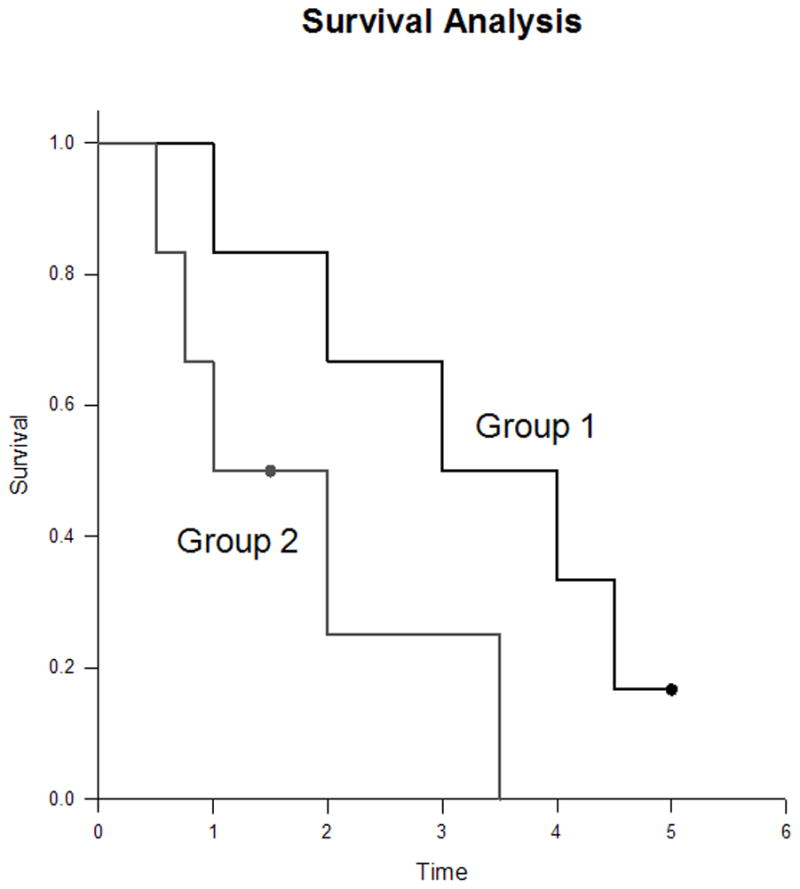
| Kaplan-Meier curves | Survival over time; good for censored data |
| Hazard ratio (Cox model) | Relative hazard adjusted for covariates |
| 5-year / 10-year survival | Standard cancer reporting |
Reporting Guidelines
The STROBE statement guides reporting of observational studies (cohort, case-control, cross-sectional). TRIPOD guides multivariable prediction model reporting, and REMARK guides prognostic tumor marker studies.
17 Harm Studies & Hill Criteria
Harm studies ask whether an exposure (drug, environmental factor, device) causes an adverse outcome. Because harms often cannot be ethically randomized, most harm evidence comes from cohorts, case-control studies, and pharmacovigilance.
Cohort vs Case-Control for Harm
| Design | Best When | Limitations |
|---|---|---|
| Cohort | Exposure is rare or multiple outcomes of interest | Inefficient for rare outcomes; long follow-up |
| Case-control | Outcome is rare | Recall bias; selection of controls |
| RCT | Common harms already being studied | Underpowered for rare adverse events |
| Pharmacovigilance (FAERS, VAERS) | Signal detection for rare events | No denominator; voluntary reporting |

Validity Criteria for Harm Studies
- Clearly identified comparison group with similar baseline risk
- Exposure and outcome measured the same way in both groups
- Sufficient follow-up
- Adjustment for confounders (including indication bias)
- Dose-response relationship where possible
Bradford Hill Criteria for Causation
Austin Bradford Hill proposed nine viewpoints in 1965 to help judge whether an observed association is causal — not a rigid checklist but a structured way to reason:
| Criterion | Meaning |
|---|---|
| Strength | Larger effect sizes are less likely to be due to confounding |
| Consistency | Repeated observation in different settings and populations |
| Specificity | One exposure → one outcome (weakest of the criteria) |
| Temporality | Cause must precede effect (essential, not optional) |
| Biological gradient | Dose-response relationship |
| Plausibility | Biologically coherent mechanism |
| Coherence | Consistent with known facts about disease |
| Experiment | Removing exposure reduces risk (when possible) |
| Analogy | Similar cause-effect relationships exist |
18 SR Methodology & PRISMA
A systematic review is the highest form of literature synthesis when done well. Its value depends entirely on the rigor of its methods — a poorly conducted SR is worse than a single well-done trial because its conclusions carry false authority.
Steps of a Systematic Review
- Frame a focused question (PICO)
- Pre-register the protocol (e.g., PROSPERO)
- Develop an explicit search strategy (multiple databases + gray literature)
- Screen titles, abstracts, and full texts in duplicate
- Extract data in duplicate with standardized forms
- Assess risk of bias in each included study (e.g., Cochrane RoB 2, ROBINS-I)
- Synthesize results (narrative and/or meta-analysis)
- Assess certainty of evidence (GRADE)
- Report transparently (PRISMA)
PRISMA — Reporting Standard
The PRISMA (Preferred Reporting Items for Systematic Reviews and Meta-Analyses) statement is a 27-item checklist and flow diagram for transparent SR reporting. The 2020 update emphasizes protocol registration, data sharing, and explicit handling of bias.
Risk-of-Bias Tools
| Tool | Study Type |
|---|---|
| Cochrane RoB 2 | RCTs (randomization, deviations from intended intervention, missing data, outcome measurement, selective reporting) |
| ROBINS-I | Non-randomized studies of interventions |
| QUADAS-2 | Diagnostic accuracy studies |
| Newcastle-Ottawa Scale | Observational studies (older but widely used) |
| AMSTAR-2 | Appraising the quality of a systematic review itself |
Cochrane Systematic Reviews
The Cochrane Collaboration produces the most methodologically rigorous systematic reviews in healthcare. Cochrane reviews follow standardized procedures documented in the Cochrane Handbook, undergo peer review, and are updated as new evidence accumulates. They are published in the Cochrane Database of Systematic Reviews (CDSR). Key features include:
- Pre-specified protocols with peer review
- Comprehensive search strategies including gray literature
- Standard risk-of-bias assessment (RoB 2)
- GRADE Summary of Findings tables
- Plain language summaries for patients
- Living review format for rapidly evolving topics
Living Systematic Reviews
A living systematic review is continuously updated as new evidence becomes available, rather than representing a snapshot in time. COVID-19 accelerated adoption of this approach — treatment guidelines needed to incorporate new RCTs within weeks rather than years. Living reviews rely on automated search alerts, streamlined screening, and modular updating.
19 Meta-Analysis & Forest Plots
Meta-analysis statistically combines results from multiple studies into a pooled effect estimate. Done well, it increases precision and power; done poorly, it produces a misleadingly confident summary of heterogeneous or biased studies.
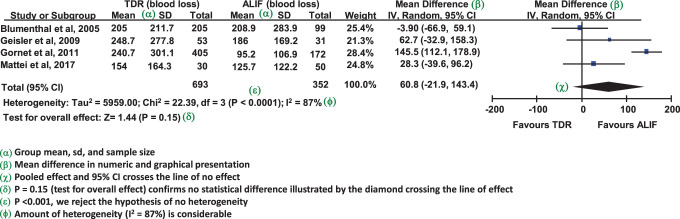
Reading a Forest Plot
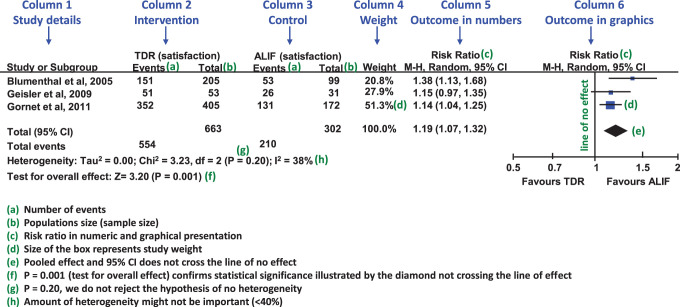
| Element | Meaning |
|---|---|
| Each horizontal line | One study’s point estimate and 95% CI |
| Box size | Weight of the study (larger box = more weight) |
| Vertical line at 1 (or 0) | Line of no effect |
| Diamond at the bottom | Pooled estimate and 95% CI; its tips are the limits |
| Studies crossing line of no effect | Individually non-significant |
| Pooled diamond not crossing line | Overall significant effect |
Fixed vs Random Effects
| Model | Assumption | When Appropriate |
|---|---|---|
| Fixed-effect (common-effect) | One true underlying effect shared by all studies | Homogeneous studies, identical populations |
| Random-effects | True effect varies between studies; pooled estimate is mean of a distribution | Heterogeneous populations or interventions; more conservative (wider CI) |
When heterogeneity is present, random-effects models are generally more appropriate because they acknowledge variability in the underlying effect. Random-effects models give more weight to small studies than fixed-effect models, which can be problematic if small studies are lower quality or biased.
Pooling Methods
| Method | Use |
|---|---|
| Mantel-Haenszel | Dichotomous outcomes, fixed-effect |
| DerSimonian-Laird | Random-effects (classical) |
| Inverse variance | Continuous outcomes |
| Peto | Rare events, odds ratios |
Sample Forest Plot Interpretation Walk-Through
Imagine a forest plot of eight trials of a new oral anticoagulant vs warfarin for stroke prevention in atrial fibrillation. Six trials show point estimates to the left of the vertical line (favoring the new drug), one is right on the line, and one is slightly to the right. The pooled diamond sits at HR 0.82 with 95% CI 0.75–0.90, I2 = 22%. What do you conclude?
- The pooled estimate shows an 18% relative reduction in stroke with the new drug.
- The 95% CI (0.75–0.90) excludes 1.0, so the result is statistically significant.
- I2 of 22% indicates low heterogeneity — studies are reasonably consistent.
- The consistency across studies (most favoring the new drug) supports the pooled finding.
But before accepting the conclusion, you would check risk of bias in each trial, whether the heterogeneity has a clinical explanation (dose, population), and whether the pooled NNT (derived from baseline stroke risk in the control arm) is clinically meaningful.
20 Heterogeneity, Publication Bias & GRADE
Heterogeneity
Heterogeneity is variation between studies beyond what would be expected by chance. Sources include clinical (different populations, interventions), methodological (different designs, risk of bias), and statistical heterogeneity.
| Statistic | Interpretation |
|---|---|
| Cochran’s Q (χ2) | Tests the null of no heterogeneity; low power with few studies |
| I2 | % of total variation due to heterogeneity rather than chance. 0–40% might not be important; 30–60% moderate; 50–90% substantial; 75–100% considerable |
| τ2 | Estimate of between-study variance in random-effects models |
Publication Bias & Funnel Plots
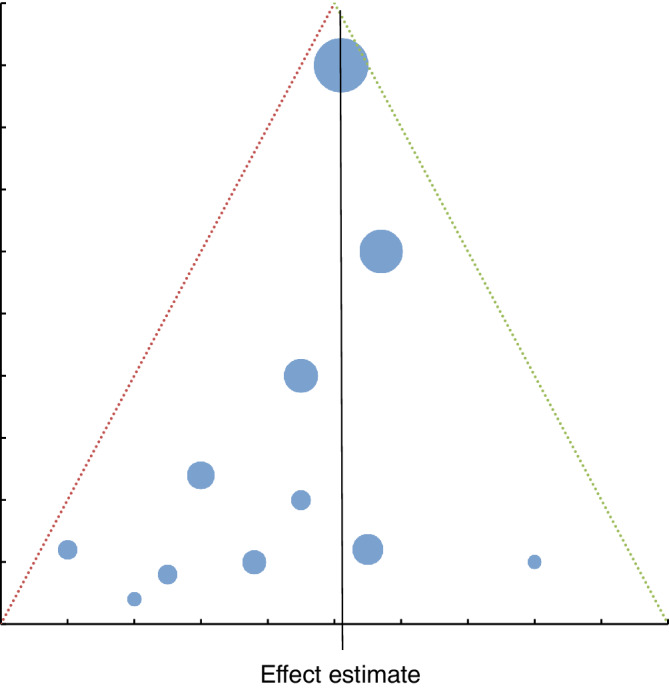
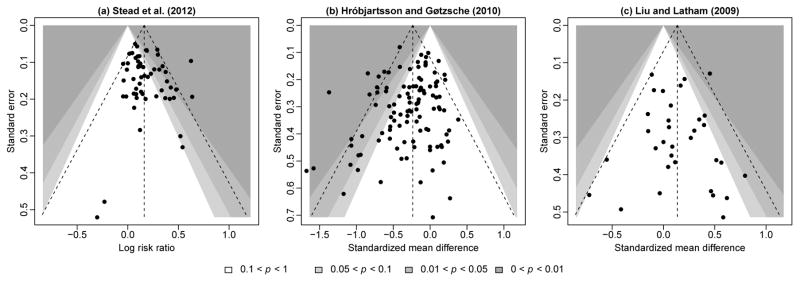
Publication bias is the preferential publication of studies with positive, statistically significant, or novel results. It inflates meta-analytic effect estimates. Detection tools include:
- Funnel plot: scatter of effect size vs precision (typically 1/SE). In the absence of bias, it is symmetric about the pooled estimate. Asymmetry suggests missing small “negative” studies.
- Egger’s test: statistical test for funnel plot asymmetry.
- Trim-and-fill: imputes missing studies to estimate an adjusted pooled effect.
GRADE is the dominant modern framework for rating the certainty of evidence and the strength of recommendations. It is used by WHO, Cochrane, NICE, ACP, and most international guideline bodies. GRADE explicitly separates certainty in the evidence from the strength of a recommendation, which also considers values, preferences, resources, and feasibility.
GRADE Certainty of Evidence
Evidence starts at High (RCTs) or Low (observational studies) and is rated up or down:
| Downgrade Reason | Upgrade Reason |
|---|---|
| Risk of bias | Large magnitude of effect |
| Inconsistency (heterogeneity) | Dose-response gradient |
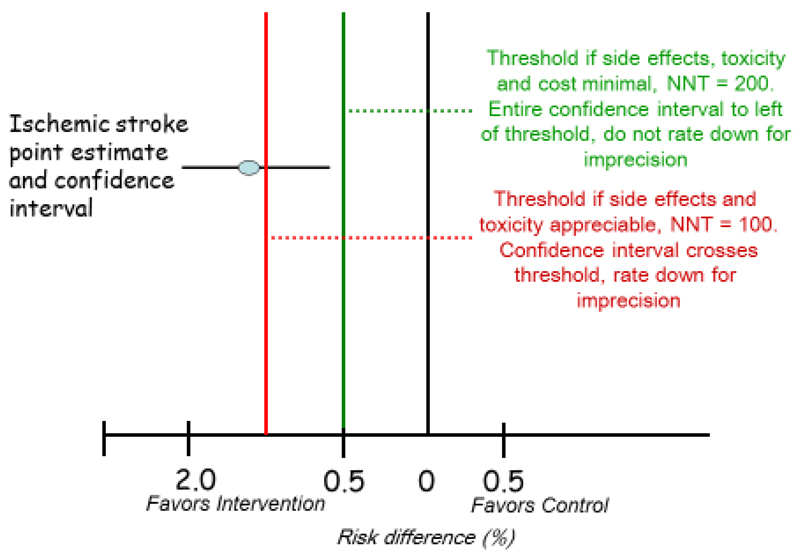
| Indirectness (applicability) | All plausible confounders would reduce the effect |
| Imprecision (wide CI) | |
| Publication bias |
| Certainty Level | Meaning |
|---|---|
| High | Very confident the true effect lies close to the estimate |
| Moderate | Moderately confident; true effect likely close but could differ |
| Low | Limited confidence; true effect may be substantially different |
| Very low | Very little confidence in the estimate |
GRADE Recommendation Strength
Recommendations are dichotomized as strong (“we recommend”) or weak / conditional (“we suggest”). Strong recommendations require high-certainty evidence and benefits clearly outweighing harms for most patients. Weak recommendations reflect uncertainty or tradeoffs — shared decision-making is particularly important here.
Summary of Findings Tables
GRADE-compliant SRs present a Summary of Findings (SoF) table: for each critical outcome, it shows the risk in the comparator group, the risk in the intervention group, the relative effect, the number of participants and studies, and the GRADE certainty with reasons for downgrading. This single table is often the most valuable artifact of a systematic review.
21 Clinical Practice Guidelines & AGREE II
Clinical practice guidelines (CPGs) are “statements that include recommendations intended to optimize patient care, informed by a systematic review of evidence and an assessment of the benefits and harms of alternative care options” (IOM, 2011). Well-made guidelines translate vast evidence into actionable recommendations; poorly made guidelines perpetuate opinion dressed as evidence.
Types of Guidelines
| Type | Example | Characteristic |
|---|---|---|
| Evidence-based (GRADE) | WHO, NICE, ACP | Systematic review + GRADE certainty ratings |
| Consensus-based | Specialty society statements | Expert agreement when evidence is sparse |
| Screening recommendations | USPSTF | Graded A–D / I based on benefit vs harm |
| Quality indicators | CMS, NQF measures | Derived from guidelines; used for payment |
Guideline Development Process
- Scope and key questions (PICO)
- Multidisciplinary panel with declared conflicts of interest
- Systematic reviews of the evidence
- Rating of evidence certainty (GRADE)
- Drafting recommendations with explicit rationale
- External review and public comment
- Publication with a planned update cycle
AGREE II — Guideline Quality Appraisal
The AGREE II (Appraisal of Guidelines for Research and Evaluation) tool assesses guideline methodology across six domains:
| Domain | Focus |
|---|---|
| Scope and purpose | Objectives, questions, target population |
| Stakeholder involvement | Panel composition, target users, patient input |
| Rigor of development | Systematic search, evidence selection, recommendation formulation |
| Clarity of presentation | Recommendations clearly stated and identifiable |
| Applicability | Barriers, facilitators, resource implications |
| Editorial independence | Funding and conflicts of interest |
Major Evidence / Recommendation Grading Systems
| System | User | Notes |
|---|---|---|
| GRADE | Cochrane, WHO, NICE, ACP | Dominant modern framework |
| USPSTF | US Preventive Services Task Force | A, B, C, D, I for preventive services |
| ACC/AHA | Cardiology | Class I/IIa/IIb/III with levels A/B/C |
| Oxford CEBM | Older but historically influential | Levels 1–5 |
22 Shared Decision-Making
Shared decision-making (SDM) is the process in which clinicians and patients make decisions together using the best available evidence, accounting for the patient’s values, preferences, and circumstances. It is the clinical operationalization of the third pillar of EBM.
When SDM Is Essential
- Preference-sensitive decisions (e.g., PSA screening, prostatectomy vs active surveillance)
- Close tradeoffs between benefits and harms
- Weak / conditional recommendations under GRADE
- Decisions with major quality-of-life implications
- Screening tests (over-diagnosis tradeoffs)
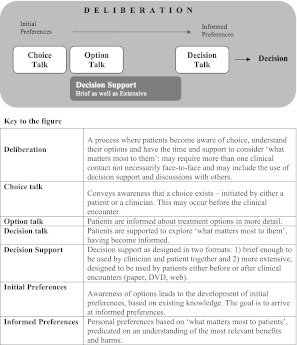
Three Talk Model (Elwyn et al.)
| Phase | Content |
|---|---|
| Team talk | “There is a choice to be made; let’s make it together.” |
| Option talk | Describe reasonable options, benefits, and harms in understandable terms |
| Decision talk | Elicit preferences and reach a decision the patient can support |
Tools for SDM
| Tool | Purpose |
|---|---|
| Decision aids (Mayo Clinic, Option Grid) | Present options, outcomes, and probabilities in patient-friendly formats |
| Pictographs / icon arrays | Visualize risks (e.g., 100-person figures) to reduce framing bias |
| Natural frequencies | “3 in 100” rather than percentages |
| Teach-back | Confirm understanding by asking patient to explain in their own words |
Framing Effects in Risk Communication
Identical data can lead to different decisions depending on how they are presented — a cognitive bias called framing. A 90% survival rate sounds better than a 10% mortality rate, though they are arithmetically identical. Best practices include:
- Present both positive and negative framings when possible
- Use consistent denominators (e.g., “3 in 100” and “97 in 100”)
- Provide absolute numbers, not only relative ones
- Use visual aids (icon arrays, bar charts)
- Avoid loaded terminology (“aggressive cancer” vs “slow-growing”)
- Describe a reasonable time horizon (“over the next 10 years”)
Barriers to SDM Implementation
| Barrier | Mitigation |
|---|---|
| Time pressure in clinic | Pre-visit decision aids, team-based SDM |
| Clinician discomfort with uncertainty | Training in risk communication; normalize honest “I don’t know” |
| Health literacy limitations | Plain language, teach-back, visual tools |
| Cultural expectations of paternalism | Culturally adapted communication |
| Reimbursement structure | Bill SDM visits (CMS codes for some decisions) |
23 Special Topics — RWE, Big Data, ML, NMA
Real-World Evidence (RWE)
Real-world evidence is clinical evidence derived from routine care data — EHRs, claims databases, registries, wearables. The FDA formally incorporates RWE in post-marketing drug and device decisions. RWE can answer questions RCTs cannot: long-term safety, use in populations excluded from trials, comparative effectiveness in everyday practice.
Big Data & Machine Learning in Medicine
| Concept | Role |
|---|---|
| Big data | Very large, often heterogeneous datasets (claims, genomics, imaging) |
| Machine learning | Algorithms that learn patterns from data (e.g., random forests, gradient boosting, deep learning) |
| Supervised learning | Labeled training data (e.g., predicting sepsis from vital signs) |
| Unsupervised learning | Discovers structure in unlabeled data (clustering, phenotyping) |
| Model validation | Internal (cross-validation), external (independent cohorts), prospective |
| Calibration vs discrimination | Calibration: predicted probabilities match observed; Discrimination: AUC |
Appraising ML prediction models uses TRIPOD-AI / TRIPOD+AI, extending TRIPOD for AI-based models. Key concerns include dataset shift, algorithmic bias, lack of transparency, and the need for prospective validation before deployment.
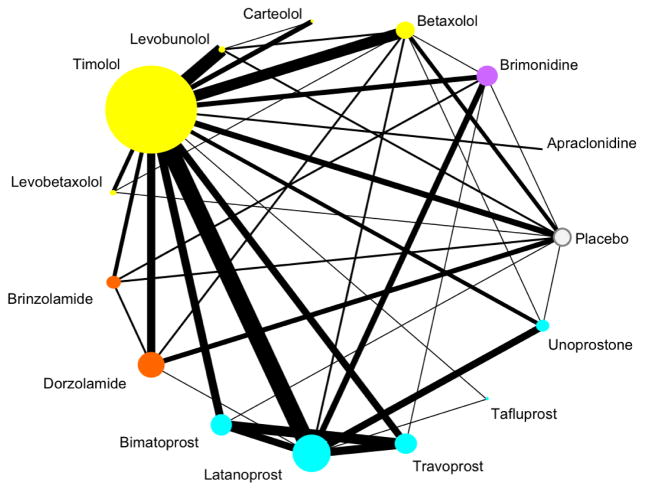
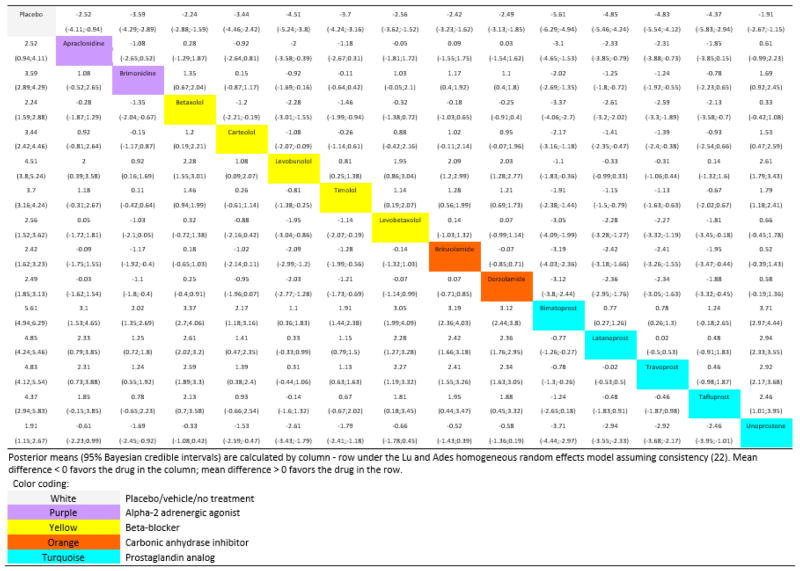
Network Meta-Analysis (NMA)
Network meta-analysis pools direct and indirect comparisons to compare multiple interventions simultaneously, even when head-to-head trials are unavailable. For example, NMA can rank several antidepressants using a network of trials in which some drugs have never been directly compared. Key assumptions include transitivity (the indirectly compared populations are similar enough to allow inference) and consistency (direct and indirect evidence agree).
Individual Patient Data Meta-Analysis (IPD-MA)
IPD-MA obtains individual participant data from each included trial rather than aggregate summary data. It is the gold standard for pooled analysis because it allows standardized re-analysis, time-to-event modeling, and subgroup analyses not possible with published summaries. The tradeoff is significant time and resource cost.
Target Trial Emulation
Target trial emulation is a modern framework in which observational data are analyzed as if they were an RCT, with the hypothetical (target) trial specified in advance. This discipline forces researchers to define eligibility, treatment strategies, assignment procedures, follow-up start, outcomes, and analysis plans up front — reducing many common observational biases such as immortal time bias and prevalent-user bias. It has become a standard approach in comparative effectiveness research using EHR and claims data.
Mendelian Randomization
Mendelian randomization uses genetic variants as instrumental variables to infer causal effects of an exposure on an outcome. Because alleles are randomly assigned at conception (Mendel’s laws), they are largely independent of confounders that plague standard observational analyses. This approach has been used to clarify the causal role of LDL cholesterol, C-reactive protein, and body mass index in cardiovascular disease. Limitations include pleiotropy (variants affecting multiple pathways) and the need for large genetic datasets.
24 Common Pitfalls in EBM
Even carefully conducted studies can mislead. The following pitfalls are among the most common reasons that apparently strong evidence fails to replicate or translate.
Statistical vs Clinical Significance (Revisited)
A p-value tells you whether an effect is likely different from zero, not whether it matters. Very large trials can produce statistically significant differences of trivial magnitude; small trials can miss clinically important effects. Always look at effect size, confidence interval, and minimum clinically important difference.
Surrogate Outcomes
Surrogate outcomes substitute a lab value or imaging finding for a patient-important outcome (e.g., LDL for cardiovascular death, HbA1c for microvascular complications, bone mineral density for fractures). They are convenient but dangerous: the CAST trial (suppressing PVCs) and rosiglitazone (lowering glucose while increasing MI) are cautionary examples. Surrogates must be validated against hard outcomes before being trusted for decision-making.
Composite Endpoints
Composite endpoints combine multiple outcomes (e.g., “MACE” = death + MI + stroke + revascularization) into a single variable to boost power. They are valid only when component outcomes are of similar importance and affected in the same direction. Beware when a composite is driven by the least important component (e.g., hospitalization) while mortality is unchanged.
Subgroup & Post-Hoc Analyses
Subgroup analyses test whether an effect varies across patient subsets. They are hypothesis-generating, not confirmatory. Pre-specified subgroups with a plausible interaction test are more trustworthy than post-hoc analyses (e.g., the infamous ISIS-2 subgroup showing no benefit of aspirin for patients born under certain astrological signs — used as a parody of subgroup analysis).
p-Hacking, HARKing & the Garden of Forking Paths
| Practice | Definition | Consequence |
|---|---|---|
| p-hacking | Trying multiple analyses until something “works” | Inflated false positive rate |
| HARKing | Hypothesizing After Results are Known | Presents exploratory findings as confirmatory |
| Outcome switching | Changing primary outcome post hoc | Selective reporting bias |
| Publication bias | Selective publication of positive results | Distorts meta-analyses |
| Spin | Framing non-significant results as positive | Misleads readers and media |
White-Coat Science & Reverse Causation
White-coat science refers to overconfident interpretation of weak evidence clothed in the authority of expertise. Reverse causation occurs when the outcome causes the exposure rather than vice versa (e.g., low cholesterol in sick patients is often the result of cachexia rather than a cause of death).
Number Needed to Treat Traps
- NNT depends on baseline risk — quote NNT only for a specific population
- NNT depends on time horizon — always specify (e.g., NNT 50 over 5 years)
- NNT must be accompanied by NNH to give a fair picture of tradeoffs
- NNT from meta-analyses may be misleading when heterogeneity is high
The Reproducibility Crisis
Large replication projects (Open Science Collaboration in psychology, the Reproducibility Project: Cancer Biology) have shown that a substantial fraction of published findings do not replicate when the same studies are repeated. Causes include low statistical power, flexible analysis, publication bias, p-hacking, and inadequate description of methods. EBM’s response has included pre-registration, data sharing, methodologic transparency (CONSORT, STROBE, PRISMA), and emphasis on systematic reviews over single studies.
Ethical Considerations in EBM
| Issue | EBM Implication |
|---|---|
| Equipoise | Ethical basis of RCTs — genuine uncertainty about which arm is better |
| Informed consent | Patients must understand that research differs from care |
| Vulnerable populations | Extra protections for children, pregnant women, prisoners, cognitively impaired |
| Data sharing | Patients whose data are used should benefit from replication and transparency |
| Placebo controls | Acceptable only when no effective standard exists or add-on design is used |
| Conflicts of interest | Industry funding systematically biases results toward sponsor interests |
25 Reference — Checklists & Tables
This section consolidates high-yield reference material — critical appraisal checklists, study design comparisons, GRADE summaries, and common database features.
Critical Appraisal Quick Checklist — Therapy
| Question | Look For |
|---|---|
| Randomized? | Method of sequence generation |
| Allocation concealed? | Central randomization or sealed opaque envelopes |
| Groups similar at baseline? | Table 1 |
| Blinded? | Participants, caregivers, outcome assessors |
| Follow-up complete? | >80% or sensitivity analysis |
| ITT analysis? | Analyzed as randomized |
| Effect size meaningful? | ARR, NNT, CI, clinical significance |
| Applicable to my patient? | Population, setting, values |
Critical Appraisal Quick Checklist — Diagnosis
| Question | Look For |
|---|---|
| Independent, blinded comparison with reference standard? | Methods section |
| Appropriate spectrum of patients? | Consecutive series, not extremes |
| Reference standard applied regardless of index test? | No verification bias |
| Methods described in enough detail to replicate? | STARD checklist |
| Sens/Spec and likelihood ratios reported? | With CIs |
Critical Appraisal Quick Checklist — Systematic Review
| Question | Look For |
|---|---|
| Focused question (PICO)? | Stated clearly |
| Protocol registered? | PROSPERO |
| Comprehensive search? | Multiple databases + gray literature |
| Study selection in duplicate? | Two reviewers with kappa |
| Risk of bias assessed? | RoB 2 or ROBINS-I |
| Heterogeneity evaluated? | I2, subgroup analysis |
| Publication bias assessed? | Funnel plot, Egger’s |
| Certainty of evidence rated? | GRADE |
Study Design Comparison
| Design | Question | Can Show Causation? | Time Direction |
|---|---|---|---|
| RCT | Therapy, prevention | Yes (strongest) | Forward |
| Cohort | Prognosis, harm, rare exposures | Supports causal inference | Forward |
| Case-control | Rare outcomes, etiology | Supports causal inference | Backward |
| Cross-sectional | Prevalence, diagnosis | No (no temporality) | Snapshot |
| Case series | Description | No | Variable |
| Ecological | Population hypothesis | No (ecological fallacy) | Snapshot |
GRADE Summary Table
| Starting Point | Downgrade For | Upgrade For |
|---|---|---|
| RCT → High | Risk of bias | Large effect |
| Observational → Low | Inconsistency | Dose-response |
| Indirectness | Confounding in opposite direction | |
| Imprecision | ||
| Publication bias |
Reporting Guidelines by Study Type
| Study Type | Guideline |
|---|---|
| RCT | CONSORT |
| Observational | STROBE |
| Systematic review | PRISMA |
| Diagnostic accuracy | STARD |
| Prediction model | TRIPOD / TRIPOD-AI |
| Qualitative | SRQR / COREQ |
| Case report | CARE |
| QI intervention | SQUIRE |
| Protocol | SPIRIT |
Common Databases — At a Glance
| Database | Strength |
|---|---|
| PubMed / MEDLINE | Broadest biomedical free resource |
| Cochrane Library | Systematic reviews & trials registry |
| Embase | European journals; pharmacology |
| CINAHL | Nursing / allied health |
| PsycINFO | Mental health |
| ClinicalTrials.gov | Trial registry & results |
| UpToDate / DynaMed | Point-of-care summaries |
| PROSPERO | SR protocol registry |
26 High-Yield Review
This final section distills the most commonly tested and clinically essential EBM concepts.
The EBM Mindset in One Paragraph
Practicing EBM means approaching every clinical decision with humility about uncertainty, discipline about evidence, and respect for patient values. It means framing answerable questions, searching efficiently, appraising critically, quantifying benefit and harm, and integrating evidence with clinical judgment at the bedside. It is not about memorizing trials — it is a durable set of skills that outlasts any individual fact and keeps practice aligned with the best available knowledge as medicine evolves.
Core Definitions to Master
| Term | One-Line Definition |
|---|---|
| EBM | Integration of best evidence, clinical expertise, and patient values |
| PICO | Population, Intervention, Comparison, Outcome |
| Sensitivity | P(test + | disease +); SnNOUT |
| Specificity | P(test − | disease −); SpPIN |
| PPV / NPV | Depend on prevalence |
| LR+ | Sn / (1 − Sp); >10 rules in |
| LR− | (1 − Sn) / Sp; <0.1 rules out |
| ARR | CER − EER; absolute benefit |
| RRR | (CER − EER) / CER |
| NNT | 1 / ARR; patients treated to prevent one event |
| NNH | 1 / ARI; patients treated to cause one harm |
| OR | Odds ratio; approximates RR when outcome is rare |
| HR | Hazard ratio; from Cox regression |
| ITT | Analyzed as randomized; preserves randomization |
| I2 | % variation due to heterogeneity |
| GRADE | Framework for certainty of evidence and recommendation strength |
Rapid-Fire Clinical Pearls
For EBM questions: (1) Identify the question type (therapy, diagnosis, prognosis, harm) — this determines the best design and appraisal framework. (2) Know validity criteria for each design (randomization, blinding, ITT for therapy; independent comparison and spectrum for diagnosis). (3) Be comfortable converting between RR, RRR, ARR, NNT, sensitivity, specificity, and likelihood ratios. (4) Memorize the 2×2 table and recompute metrics quickly. (5) Recognize common biases (selection, performance, attrition, verification, spectrum, publication). (6) Apply GRADE thinking: start with design, adjust for quality, interpret in light of effect size and precision. These six skills resolve the vast majority of EBM and biostatistics questions on any exam and, more importantly, at the bedside.