Lab Interpretation
Systematic interpretation of common laboratory tests across hematology, chemistry, coagulation, microbiology, endocrinology, and toxicology. Reference ranges, critical values, abnormal patterns, and the differential diagnoses needed to act on lab results.
01 Reference Ranges & Critical Values

Laboratory interpretation is the core cognitive skill that translates a column of numbers into a diagnosis, a treatment, or an urgent phone call. Every lab result must be interpreted in the context of the patient, the pre-test probability, the assay characteristics, and the timing of the measurement. A number outside the reference range is not automatically pathologic; a number inside the reference range is not automatically reassuring.
Clinicians order billions of lab tests annually, and the majority of diagnostic errors involve either failure to order the right test, failure to act on an abnormal result, or misinterpretation of a normal result in a sick patient. Mastery of lab interpretation is the single highest-yield clinical skill for avoiding diagnostic error.
Reference Range Definitions
A reference range is typically defined as the central 95% of values from a healthy reference population — meaning that by definition, 5% of healthy individuals will fall outside any given reference interval. When multiple independent tests are ordered (e.g., a 14-analyte CMP), the probability that at least one result will fall outside the reference range purely by chance exceeds 50%. This statistical reality is why interpretation must always be anchored to clinical pre-test probability, not to reference range flags alone.
Critical Values Requiring Immediate Action
| Analyte | Critical Low | Critical High |
|---|---|---|
| Sodium | <120 mmol/L | >160 mmol/L |
| Potassium | <2.8 mmol/L | >6.2 mmol/L |
| Glucose | <40 mg/dL | >500 mg/dL |
| Calcium (total) | <6.5 mg/dL | >13.0 mg/dL |
| Magnesium | <1.0 mg/dL | >4.7 mg/dL |
| Hemoglobin | <6.5 g/dL | >20 g/dL |
| Platelets | <20 ×109/L | >1000 ×109/L |
| WBC | <1.0 ×10⁹/L | >50 ×109/L |
| INR | — | >5.0 |
| pH | <7.20 | >7.60 |
| PaO2 | <55 mmHg | — |
| PaCO2 | <20 mmHg | >70 mmHg |
| Troponin I/T | — | >99th percentile (assay-specific) |
| Lactate | — | >4 mmol/L |
The Gaussian Trap
Many lab values are not normally distributed — they are skewed (ferritin, triglycerides, liver enzymes, hormones). Reference intervals derived by assuming a Gaussian distribution may misrepresent the true 2.5th and 97.5th percentiles, leading to overcalling "abnormality" on one tail and underestimating it on the other. Log-transformed reference intervals are more accurate for skewed analytes, but not every lab reports them. Clinically, this means that a ferritin of 15 ng/mL may be flagged "normal" while already representing iron depletion, and an ALT of 35 U/L may be flagged "normal" while being inappropriately high for a thin, healthy young woman.
Age, Sex & Population-Specific Ranges
| Analyte | Variation |
|---|---|
| Creatinine | Lower in women, elderly, low muscle mass; higher in muscular young men |
| Alkaline phosphatase | 2–3× adult normal in children and adolescents (growth plates) |
| Hemoglobin | Lower in women, pregnancy (dilutional), infants after 2 months (physiologic nadir) |
| TSH | Gestational-age-specific ranges in pregnancy; higher upper limit in elderly |
| D-dimer | Rises with age; use age-adjusted cutoff (age × 10 ng/mL >50 yr) |
| BNP / NT-proBNP | Higher in women, elderly, CKD; lower in obesity |
| Troponin | Sex-specific 99th percentiles with high-sensitivity assays |
Units: Conventional vs SI
US laboratories typically report in conventional units (mg/dL, g/dL, μg/mL), while most of the world uses SI units (mmol/L, g/L, μmol/L). Common conversions worth memorizing: creatinine mg/dL × 88.4 = μmol/L; glucose mg/dL × 0.0555 = mmol/L; calcium mg/dL × 0.25 = mmol/L; bilirubin mg/dL × 17.1 = μmol/L. Misreading the units (mg/dL vs mg/L) is a classic source of 10-fold dosing errors.
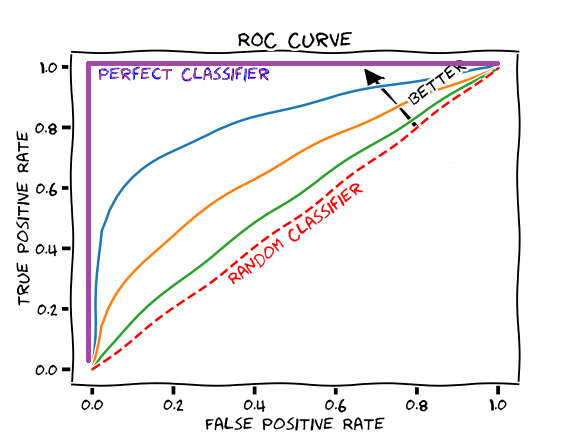
02 Test Characteristics & Bayesian Reasoning
Every diagnostic test has four fundamental characteristics that govern its clinical utility: sensitivity, specificity, positive predictive value (PPV), and negative predictive value (NPV). Sensitivity and specificity are properties of the test itself; predictive values depend on the prevalence (pre-test probability) of disease in the population being tested.
The Core Definitions
| Metric | Formula | Interpretation |
|---|---|---|
| Sensitivity | TP / (TP + FN) | Probability a diseased patient tests positive; high sensitivity rules disease OUT when negative (SnNout) |
| Specificity | TN / (TN + FP) | Probability a healthy patient tests negative; high specificity rules disease IN when positive (SpPin) |
| PPV | TP / (TP + FP) | Probability of disease given a positive test; increases with prevalence |
| NPV | TN / (TN + FN) | Probability of no disease given a negative test; decreases with prevalence |
| LR+ | Sens / (1 − Spec) | How much a positive test raises post-test odds; >10 is strong |
| LR− | (1 − Sens) / Spec | How much a negative test lowers post-test odds; <0.1 is strong |
Bayesian Reasoning in Practice
Post-test probability = (pre-test odds × likelihood ratio) converted back to probability. The clinical implication: a highly sensitive and specific test is useless when applied to a population with extremely low pre-test probability, because even a small false-positive rate will produce more false positives than true positives. This is the mathematics behind "don't order a d-dimer on a patient with PERC-negative low-probability PE" and "don't screen 20-year-olds for prostate cancer."
D-dimer has ~95% sensitivity and ~50% specificity for PE. In a Wells low-probability patient (pre-test probability ~5%), a negative d-dimer drops post-test probability to <1%, effectively ruling out PE. In a Wells high-probability patient (pre-test probability ~40%), the same negative d-dimer still leaves post-test probability around 7–10%, too high to defer imaging. Same test, same result, different action — because Bayes.
Sources of Diagnostic Error
Common Bayesian errors include base rate neglect (forgetting that a rare disease remains rare even after a positive test), anchoring (sticking with an initial impression despite contrary data), and the representativeness heuristic (matching the patient to a classic vignette while ignoring prevalence). The correct approach is to explicitly estimate pre-test probability before ordering the test, choose the test whose likelihood ratio will move probability across an action threshold, and then update.
Screening vs Diagnostic Testing
A screening test is applied to an asymptomatic population and should prioritize high sensitivity (minimizing false negatives, accepting more false positives which will be adjudicated by confirmatory testing). A diagnostic test is applied to a symptomatic or higher-risk population and should prioritize high specificity and positive likelihood ratio. Mismatching the test to the context (ordering screening tests in high-prevalence populations, or diagnostic tests in asymptomatic people) produces predictable errors. For example, HIV screening uses a highly sensitive ELISA; a positive is confirmed with a specific Western blot or differentiation assay. Troponin in the emergency department is used diagnostically, with serial changes at tight thresholds.
Reflex & Cascade Testing
Many labs run reflex algorithms: a positive HIV screen automatically triggers confirmatory testing; a high TSH reflexes to free T4; a positive hepatitis C antibody reflexes to HCV RNA. Understanding these algorithms prevents unnecessary duplicate orders and ensures appropriate follow-up. Cascade testing (one abnormal result triggering an ever-widening workup) must be resisted unless each step is clinically justified — otherwise a single borderline value snowballs into thousands of dollars of testing.
03 Pre-Analytic Errors & Specimen Integrity
The majority of laboratory errors occur not in the analyzer but in the pre-analytic phase — during specimen collection, handling, labeling, and transport. A hemolyzed sample, a mislabeled tube, or a delayed transport can invalidate a result entirely or produce a spuriously abnormal value that triggers unnecessary intervention.
Tube Color, Additive & Purpose
| Tube Color | Additive | Common Tests |
|---|---|---|
| Red | None (serum) | Chemistries, serology, drug levels |
| Gold / Tiger (SST) | Clot activator + gel | Most chemistries, troponin, lipids |
| Light Blue | Sodium citrate (3.2%) | PT/INR, aPTT, fibrinogen, d-dimer |
| Green | Lithium or sodium heparin | Plasma chemistries, ammonia, ionized Ca |
| Lavender / Purple | EDTA (K2 or K3) | CBC, HbA1c, blood typing, lead |
| Gray | Sodium fluoride + potassium oxalate | Glucose, lactate, alcohol |
| Royal Blue | Trace-element free | Heavy metals, zinc, copper |
| Yellow (ACD) | Acid citrate dextrose | HLA typing, flow cytometry |
Hemolysis, Lipemia & Icterus
Hemolysis releases intracellular contents into serum, spuriously elevating potassium, LDH, AST, phosphate, and magnesium, while decreasing sodium by dilution. Potassium in particular can rise 0.5–1.0 mmol/L with visible hemolysis and far higher with severe hemolysis. Never treat "hyperkalemia" on a hemolyzed sample without a repeat draw — the classic error is pushing calcium gluconate and insulin on a patient with a pristine heart and a pristine serum potassium.
Lipemia (turbid post-prandial sample or hypertriglyceridemia) interferes optically, falsely depressing sodium (pseudohyponatremia) on certain analyzers, and distorting many spectrophotometric assays. Icterus (high bilirubin) interferes with creatinine by Jaffe method, lipids, and total protein.
Classic Pre-Analytic Traps
| Error | Effect | Prevention |
|---|---|---|
| Tourniquet >1 min | Falsely ↑ potassium, calcium, protein, bilirubin | Release before draw |
| Fist clenching | Falsely ↑ potassium | Relaxed fist |
| Drawing above IV | Dilution; contamination from fluids | Draw from opposite arm |
| Underfilled citrate tube | Falsely ↑ PT/INR, aPTT | Fill to the line |
| EDTA contamination | Falsely ↑ K, ↓ Ca, ↓ Mg, ↓ alkaline phosphatase | Order of draw |
| Delayed transport (glucose) | Glycolysis drops glucose ~7 mg/dL/hr | Gray top or centrifuge promptly |
| Ammonia not on ice | Falsely ↑ ammonia | Place on ice immediately |
| Lactate delay | Falsely ↑ lactate | Gray top or ice |
Spurious Results to Recognize Immediately
| Scenario | Mechanism | Approach |
|---|---|---|
| Hyperkalemia in well patient | Hemolysis, fist clench, EDTA carryover, thrombocytosis (platelet K release in serum) | Repeat in green top; check plasma K |
| Isolated elevated ALP | Bone source (growth, Paget, mets), pregnancy (placental) | GGT to confirm biliary origin |
| Low sodium (pseudo) | Severe hyperlipidemia, hyperproteinemia, hyperglycemia | Direct ISE; correct for glucose |
| Low TSH | Assay interference (biotin), NTIS, dopamine, steroids | Hold biotin 48 hr; check free T4 |
| Elevated troponin without MI | CKD, myocarditis, sepsis, PE | Dynamic change, ECG, clinical context |
| Macrocytosis without anemia | Alcohol, hypothyroid, drugs | Check B12, folate, TSH, liver enzymes |
| Elevated LDH | Hemolysis (in vivo or in vitro), tissue injury, lymphoma | Haptoglobin, smear |
| Low albumin | Malnutrition, liver disease, nephrotic, inflammation (negative APR) | Check context; urine protein |
04 RBC Indices & the Anemia Workup
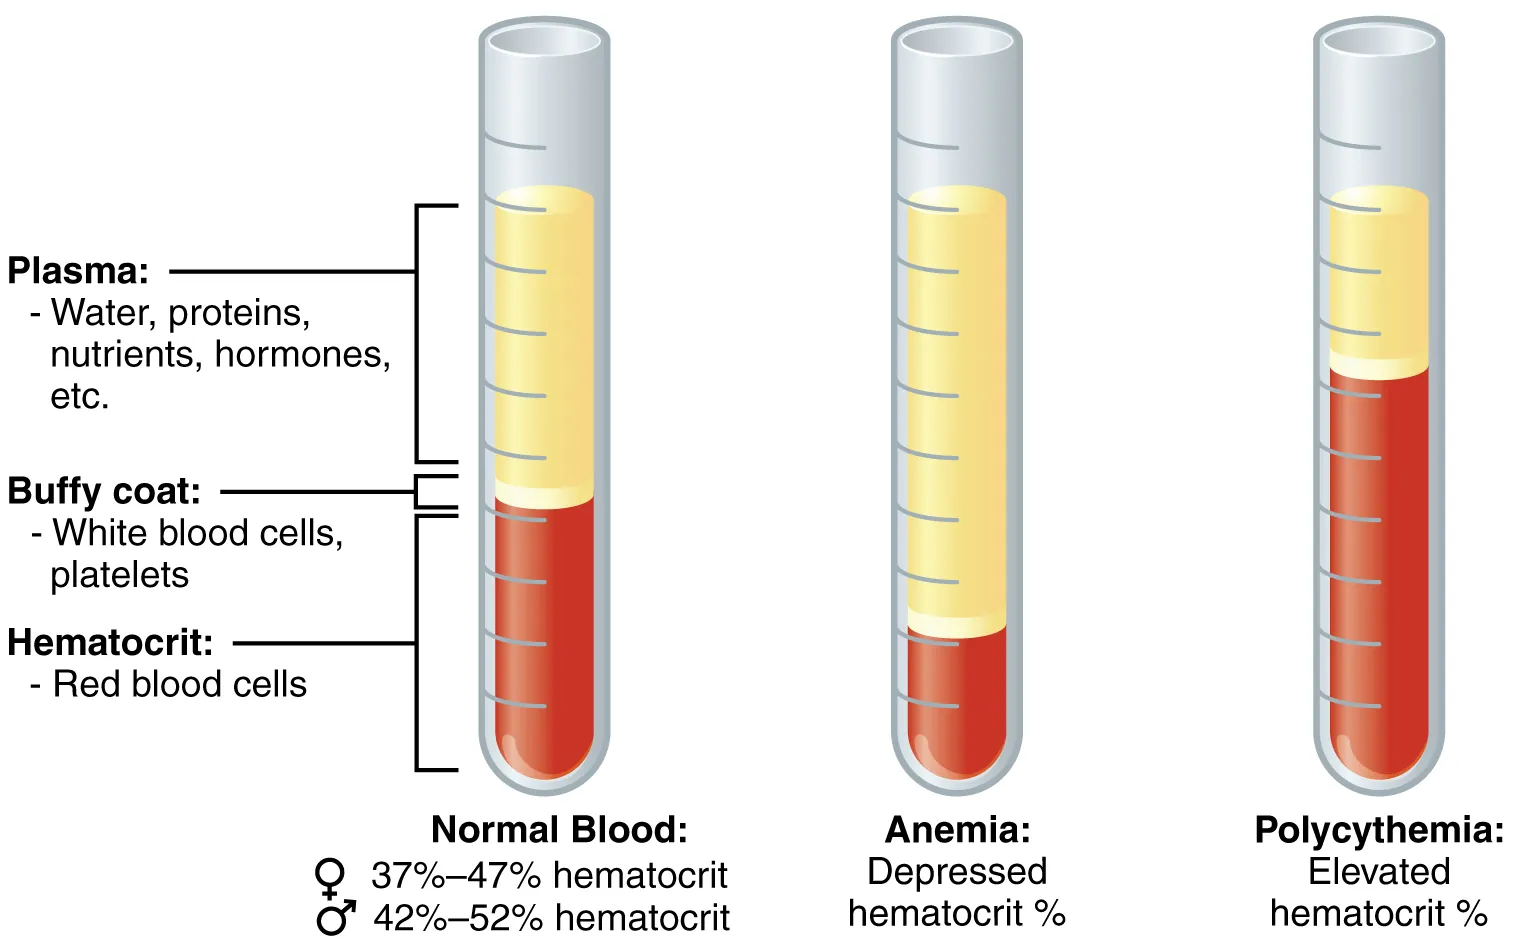
Anemia is defined by the WHO as hemoglobin <13 g/dL in men or <12 g/dL in women. The foundational move in any anemia workup is to classify by mean corpuscular volume (MCV) into microcytic (<80 fL), normocytic (80–100 fL), or macrocytic (>100 fL), then to integrate reticulocyte response and peripheral smear findings. Getting this right the first time avoids the costly habit of ordering scattershot iron/B12/folate/SPEP panels on every anemic patient.
The RBC Indices
| Index | Normal | Meaning |
|---|---|---|
| Hemoglobin (Hb) | M 13.5–17.5; F 12.0–15.5 g/dL | Oxygen-carrying capacity |
| Hematocrit (Hct) | ~3 × Hb | % of blood volume that is RBCs |
| MCV | 80–100 fL | Average RBC volume |
| MCH | 27–33 pg | Hb per RBC |
| MCHC | 32–36 g/dL | Hb concentration per RBC; ↑ in spherocytosis |
| RDW | 11.5–14.5% | Size variation (anisocytosis); ↑ in IDA, mixed anemias |
Microcytic Anemia (MCV <80)
| Cause | Iron | TIBC | Ferritin | RDW | Key Feature |
|---|---|---|---|---|---|
| Iron deficiency (IDA) | ↓ | ↑ | ↓ | ↑ | Ferritin <30 is diagnostic |
| Anemia of chronic disease | ↓ | ↓ | N or ↑ | N | Sequestration; high hepcidin |
| Thalassemia | N | N | N | N | Very low MCV, normal RDW, target cells |
| Sideroblastic | ↑ | N | ↑ | ↑ | Ringed sideroblasts; lead, alcohol, INH |
| Lead poisoning | ↑ | N | N | ↑ | Basophilic stippling |
Normocytic Anemia (MCV 80–100)
Divide by reticulocyte index. A low retic index (<2%) suggests hypoproliferation: anemia of chronic disease, chronic kidney disease (low erythropoietin), early iron deficiency, aplastic anemia, marrow infiltration, and endocrine disease. A high retic index (>2%) suggests either hemolysis or acute blood loss. Key tests: LDH, haptoglobin, indirect bilirubin, peripheral smear, direct antiglobulin test (Coombs), creatinine, EPO level.
Macrocytic Anemia (MCV >100)
| Category | Causes | Clues |
|---|---|---|
| Megaloblastic | B12 deficiency, folate deficiency, methotrexate, hydroxyurea, zidovudine | Hypersegmented neutrophils (>5 lobes), oval macrocytes, pancytopenia |
| Non-megaloblastic | Alcohol, liver disease, hypothyroidism, MDS, reticulocytosis | Round macrocytes, target cells (liver), no hypersegmentation |
05 Iron Studies, B12 & Folate
Iron studies are the most commonly misinterpreted panel in hematology. The five components are serum iron, total iron-binding capacity (TIBC), transferrin saturation (iron/TIBC × 100), ferritin, and sometimes soluble transferrin receptor. Each has pitfalls.
Interpretation Framework
| Marker | Normal | Interpretation Pitfalls |
|---|---|---|
| Serum iron | 60–170 μg/dL | Diurnal variation (peak AM); drops in acute illness |
| TIBC (transferrin) | 240–450 μg/dL | ↑ in IDA, pregnancy, OCPs; ↓ in inflammation, malnutrition |
| Transferrin saturation | 20–50% | <15% suggests IDA; >45% suggests iron overload / hemochromatosis |
| Ferritin | M 30–400; F 15–200 ng/mL | Acute phase reactant — may be falsely normal/high in IDA + inflammation |
| Soluble transferrin receptor | varies | ↑ in iron deficiency; unaffected by inflammation — useful to distinguish IDA from ACD |
B12 & Folate
Vitamin B12 (cobalamin) is absorbed in the terminal ileum bound to intrinsic factor secreted by parietal cells. Causes of deficiency include pernicious anemia (autoimmune parietal cell destruction), gastrectomy, terminal ileal disease (Crohn's, resection), bacterial overgrowth, tapeworm (Diphyllobothrium latum), strict vegan diet, and chronic PPI/metformin use. Folate deficiency occurs in malnutrition, alcoholism, pregnancy, hemolysis, methotrexate, trimethoprim, and phenytoin.
| Finding | B12 Deficiency | Folate Deficiency |
|---|---|---|
| MMA | ↑ | Normal |
| Homocysteine | ↑ | ↑ |
| Neurologic symptoms | Yes (dorsal columns, peripheral nerves) | No |
| RBC folate | Normal/low | Low |
| Anti-intrinsic factor Ab | Positive in pernicious anemia | Negative |
06 Reticulocytes & Hemolysis Labs
The reticulocyte count is the single most important test for classifying anemia: it tells you whether the marrow is responding appropriately to the drop in hemoglobin. A raw reticulocyte percentage must be corrected for the degree of anemia, because a 2% retic count in a patient with Hct 15 represents a failed marrow, not a robust response.
Reticulocyte Index Calculation
Absolute reticulocyte count = retic% × RBC count. Corrected retic count = retic% × (patient Hct / 45). Reticulocyte production index (RPI) = corrected retic / maturation factor (1.0 at Hct 45, 1.5 at 35, 2.0 at 25, 2.5 at 15). An RPI >2 suggests appropriate marrow response (hemolysis or acute blood loss); RPI <2 suggests hypoproliferation.
Hemolysis Lab Panel
| Marker | Change in Hemolysis | Notes |
|---|---|---|
| LDH | ↑↑ | Released from lysed RBCs; also from tissue injury, malignancy |
| Haptoglobin | ↓↓ | Binds free Hb; <25 mg/dL in intravascular hemolysis |
| Indirect bilirubin | ↑ | Unconjugated — rarely >5 mg/dL in pure hemolysis |
| Reticulocytes | ↑ | Marrow response (unless suppressed, e.g., parvovirus) |
| Urine hemosiderin | Positive | Chronic intravascular hemolysis (PNH) |
| Direct antiglobulin test (Coombs) | Positive | Immune-mediated hemolysis (warm or cold) |
Intravascular vs Extravascular
Intravascular hemolysis (mechanical fragmentation, complement-mediated lysis, G6PD with oxidant stress) produces hemoglobinemia, hemoglobinuria, severely reduced haptoglobin, and schistocytes on smear. Extravascular hemolysis (splenic destruction of coated or abnormally shaped RBCs) produces splenomegaly, more modest haptoglobin drop, and spherocytes or other abnormal shapes.
07 WBC Differential & Leukocyte Disorders
The total WBC count is less informative than the differential. A normal WBC with a profound left shift, a normal WBC with severe lymphopenia, or an "elevated" WBC that is all mature neutrophils in an exercised patient each tell very different stories.
Normal Differential
| Cell Type | Percent | Absolute (×109/L) |
|---|---|---|
| Neutrophils | 40–70% | 1.8–7.5 |
| Lymphocytes | 20–45% | 1.0–4.0 |
| Monocytes | 2–10% | 0.2–0.8 |
| Eosinophils | 1–6% | 0.0–0.5 |
| Basophils | 0–2% | 0.0–0.2 |
Neutrophilia & Left Shift
Neutrophilia (>7.5 ×10⁹/L) reflects infection, inflammation, stress (catecholamines demarginate neutrophils), glucocorticoids, smoking, hematologic malignancy (CML, chronic neutrophilic leukemia), or myeloproliferative disease. A left shift means increased band forms and immature neutrophils (metamyelocytes, myelocytes) in the peripheral blood — a marker of accelerated marrow release typical of severe infection. Toxic granulation, Döhle bodies, and cytoplasmic vacuoles are morphologic features of neutrophils responding to severe bacterial infection.
Neutropenia
| ANC (×109/L) | Category | Infection Risk |
|---|---|---|
| 1.0–1.5 | Mild | Low |
| 0.5–1.0 | Moderate | Moderate |
| <0.5 | Severe | High; febrile neutropenia is an emergency |
| <0.2 | Profound (agranulocytosis) | Very high; isolate, empiric antibiotics |
Causes include chemotherapy, radiation, drugs (clozapine, methimazole, PTU, sulfa, carbamazepine), viral infection (HIV, EBV, CMV, parvovirus), autoimmune disease, B12/folate deficiency, hypersplenism, congenital syndromes (cyclic neutropenia, Kostmann), and aplastic anemia. Benign ethnic neutropenia is common in patients of African descent and does not confer infection risk.
Lymphocytosis, Monocytosis, Eosinophilia
| Abnormality | Common Causes |
|---|---|
| Lymphocytosis | Viral infection (EBV, CMV, HIV, hepatitis), pertussis, CLL, ALL |
| Lymphopenia | HIV, steroids, chemo, radiation, sepsis, sarcoidosis, SLE |
| Monocytosis | TB, endocarditis, IBD, CMML, recovery from neutropenia |
| Eosinophilia | NAACP: Neoplasm, Allergy/asthma, Addison's, Collagen vascular, Parasites; also drugs (DRESS), eosinophilic syndromes |
| Basophilia | CML (classic), allergic reactions, hypothyroidism |
08 Platelets & Pancytopenia
Normal platelet count is 150–450 ×109/L. Thrombocytopenia is defined as <150, with bleeding risk meaningful <50 and spontaneous bleeding risk substantial <20.
Thrombocytopenia Differential
| Mechanism | Causes |
|---|---|
| Decreased production | Marrow infiltration, aplastic anemia, chemo/radiation, alcohol, B12/folate, MDS, viral suppression |
| Increased destruction (immune) | ITP, drug-induced (heparin, quinine, sulfa, vancomycin), SLE, HIV, HCV, post-transfusion purpura |
| Increased destruction (non-immune) | DIC, TTP, HUS, HELLP, preeclampsia, mechanical valve, prosthetic, sepsis |
| Sequestration | Hypersplenism (cirrhosis, portal hypertension) |
| Dilution | Massive transfusion, crystalloid resuscitation |
| Pseudothrombocytopenia | EDTA-induced platelet clumping — redraw in citrate |
TTP classically presents with the pentad of microangiopathic hemolytic anemia, thrombocytopenia, neurologic symptoms, renal dysfunction, and fever — but the full pentad is present in only ~40% of cases. Any patient with MAHA plus thrombocytopenia and no alternative explanation should be treated as TTP until ADAMTS13 activity returns. Platelet transfusion in TTP can be catastrophic.
Thrombocytosis
Platelet counts >450 can be reactive (iron deficiency, infection, inflammation, malignancy, post-splenectomy, post-hemorrhage) or primary (essential thrombocythemia, polycythemia vera, CML, primary myelofibrosis). Reactive thrombocytosis rarely requires intervention. Primary thrombocytosis with counts >1000 carries both bleeding and thrombotic risk and is worked up with JAK2, CALR, and MPL mutations.
Pancytopenia
Simultaneous reduction in all three cell lines points to marrow failure or marrow replacement. Differential: aplastic anemia, MDS, acute leukemia, myelofibrosis, marrow infiltration (metastatic cancer, lymphoma, granulomas), megaloblastic anemia (B12/folate), hypersplenism, PNH, drugs, sepsis, SLE, HIV. Peripheral smear plus bone marrow biopsy are the definitive next steps.
09 Peripheral Blood Smear Findings
The peripheral smear remains one of the highest-yield tests in medicine. A single slide can establish the diagnosis of TTP, sickle cell crisis, malaria, acute leukemia, hereditary spherocytosis, or lead poisoning, each of which might be delayed or missed by reliance on indices alone.
RBC Morphology
| Finding | Appearance | Associations |
|---|---|---|
| Schistocytes | Fragmented RBCs, helmet cells | MAHA: TTP, HUS, DIC, HELLP, mechanical valve, malignant HTN |
| Spherocytes | Dense, round, no central pallor | Hereditary spherocytosis, warm AIHA, burns |
| Target cells | Bullseye appearance | Liver disease, thalassemia, HbC, post-splenectomy |
| Sickle cells | Crescent-shaped | Sickle cell disease/trait |
| Teardrop cells (dacrocytes) | Tear-shaped | Myelofibrosis, marrow infiltration |
| Bite cells | Semicircular defect | G6PD deficiency (splenic removal of Heinz bodies) |
| Rouleaux | Stacked coins | Multiple myeloma, Waldenström's, high fibrinogen |
| Basophilic stippling | Coarse blue dots | Lead poisoning, thalassemia, sideroblastic |
| Howell-Jolly bodies | Nuclear remnant | Asplenia, functional hyposplenism |
| Heinz bodies | Denatured Hb (supravital stain) | G6PD deficiency, oxidant stress |
| Pappenheimer bodies | Iron granules | Sideroblastic anemia, hemolysis |
WBC & Platelet Morphology
| Finding | Meaning |
|---|---|
| Blasts | Acute leukemia (AML if Auer rods; ALL if no granules) |
| Auer rods | Pathognomonic for AML (especially APL/M3) |
| Hypersegmented neutrophils | B12 or folate deficiency |
| Smudge cells | CLL (fragile lymphocytes on smear prep) |
| Atypical lymphocytes | Viral infection, classically EBV mononucleosis |
| Giant platelets | ITP, Bernard-Soulier, May-Hegglin |
| Platelet clumps | Pseudothrombocytopenia (EDTA) |
Parasites & Inclusions
| Finding | Organism / Meaning |
|---|---|
| Intra-erythrocytic ring forms | Malaria (Plasmodium species); thick and thin smears for species ID and parasitemia quantification |
| Maltese cross tetrads | Babesiosis |
| Morulae in monocytes | Ehrlichiosis |
| Morulae in neutrophils | Anaplasmosis |
| Borrelia in plasma | Relapsing fever |
| Trypanosomes in plasma | African or American trypanosomiasis |
Malaria species ID on thin smear is based on infected RBC size, presence of Schuffner's stippling (P. vivax/ovale), banana-shaped gametocytes (P. falciparum), and parasitemia percentage — >5% parasitemia with falciparum is severe malaria and warrants IV artesunate and consideration of exchange transfusion.
10 PT/INR, aPTT, TT & Mixing Studies
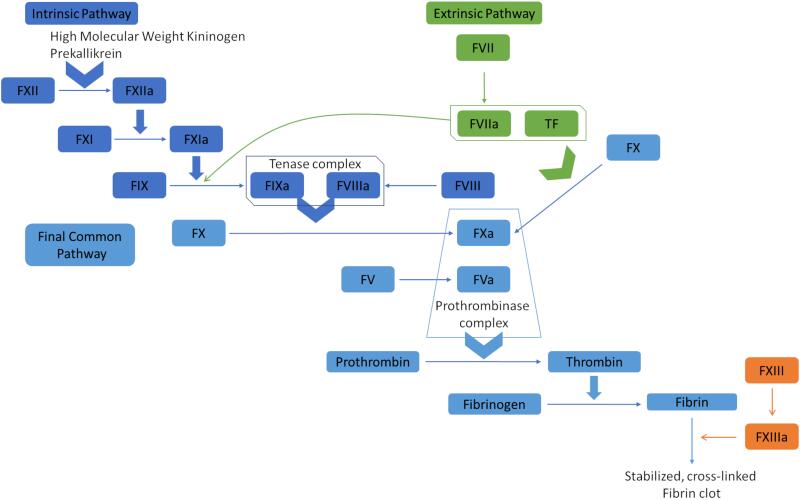
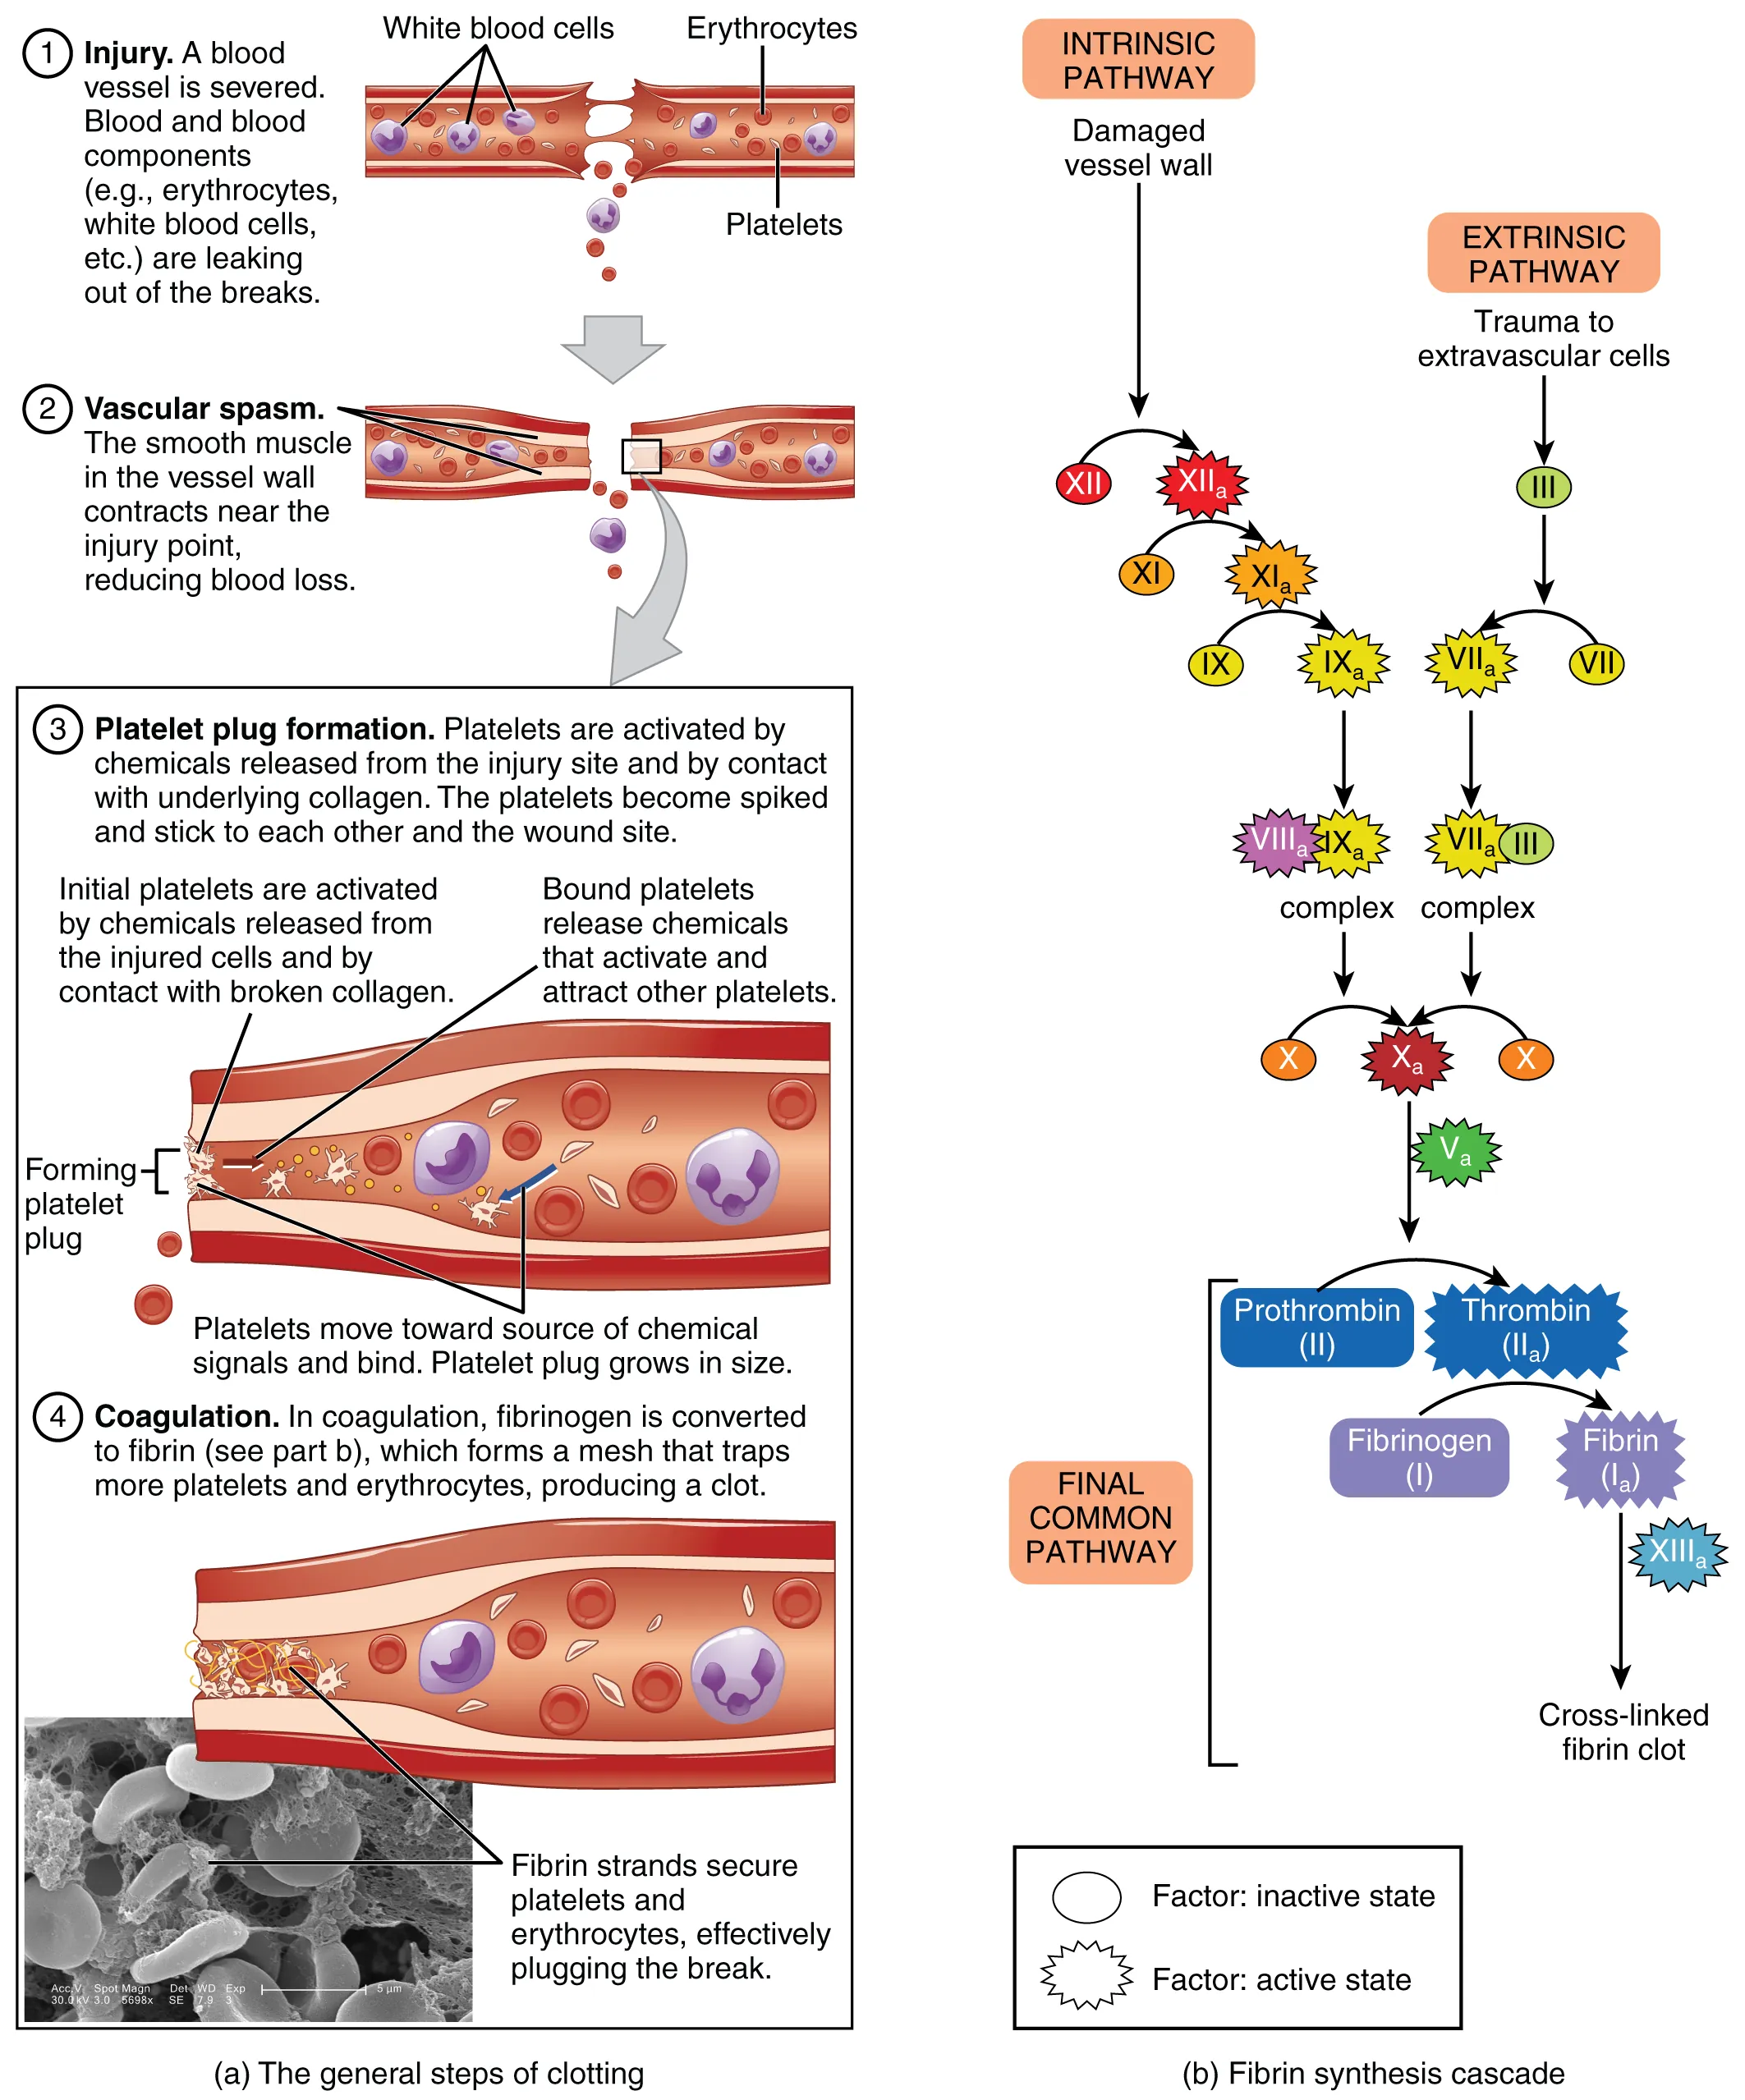
The standard coagulation panel measures three pathways: PT (prothrombin time, reported as INR) tests the extrinsic and common pathways (factors VII, X, V, II, fibrinogen); aPTT (activated partial thromboplastin time) tests the intrinsic and common pathways (XII, XI, IX, VIII, X, V, II, fibrinogen); TT (thrombin time) tests the final conversion of fibrinogen to fibrin.
Normal Ranges
| Test | Normal | Sensitive To |
|---|---|---|
| PT | 11–13.5 sec | Factor VII, warfarin, liver disease, vitamin K deficiency |
| INR | 0.9–1.1 | Standardized PT; used for warfarin monitoring |
| aPTT | 25–35 sec | Factors VIII, IX, XI, XII; heparin, lupus anticoagulant |
| TT | 14–19 sec | Dysfibrinogenemia, heparin, direct thrombin inhibitors |
| Fibrinogen | 200–400 mg/dL | Consumption (DIC), hepatic failure, dysfibrinogenemia |
| D-dimer | <500 ng/mL FEU | Fibrin degradation; ↑ in VTE, DIC, pregnancy, surgery, infection, malignancy |
The PT/aPTT Matrix
| Pattern | Differential |
|---|---|
| ↑PT, normal aPTT | Early warfarin, vitamin K deficiency, factor VII deficiency, early liver disease |
| Normal PT, ↑aPTT | Heparin, hemophilia A (VIII) or B (IX), factor XI/XII deficiency, vWD, lupus anticoagulant |
| ↑PT, ↑aPTT | Warfarin (late), DIC, liver disease, vitamin K deficiency (severe), common pathway defect, combined deficiency, supratherapeutic heparin |
| Normal PT, normal aPTT, bleeding | Platelet dysfunction, vWD (mild), factor XIII deficiency, vascular cause |
Mixing Studies
When PT or aPTT is prolonged, a mixing study (1:1 mix with normal plasma) distinguishes factor deficiency from inhibitor. If the prolonged time corrects to normal after mixing, the patient has a factor deficiency (the normal plasma supplied the missing factor). If it fails to correct, an inhibitor is present — most commonly a lupus anticoagulant or an acquired factor inhibitor (classically factor VIII inhibitor in acquired hemophilia).
11 Anticoagulant Monitoring & DIC
Warfarin
Warfarin inhibits vitamin K epoxide reductase, depleting functional factors II, VII, IX, X and proteins C and S. Monitor with INR. Standard target 2.0–3.0 for most indications (AFib, VTE, tissue valves); 2.5–3.5 for mechanical mitral valves and some antiphospholipid syndrome. INR >5 without bleeding: hold doses and consider low-dose oral vitamin K. INR with major bleeding: 4-factor PCC (preferred) plus IV vitamin K; FFP is second-line when PCC unavailable.
Heparin
| Drug | Monitoring | Target |
|---|---|---|
| Unfractionated heparin | aPTT or anti-Xa | aPTT 1.5–2.5 × control; anti-Xa 0.3–0.7 IU/mL |
| LMWH (enoxaparin) | Anti-Xa (only in obesity, renal failure, pregnancy) | 0.5–1.0 IU/mL (peak, 4 hr post-dose) |
| Fondaparinux | Anti-Xa if needed | 0.5–1.5 IU/mL |
| Argatroban | aPTT | 1.5–3 × baseline |
| Bivalirudin | aPTT or ACT | ACT 300–400 during PCI |
DOACs
Direct oral anticoagulants (apixaban, rivaroxaban, edoxaban, dabigatran) do not require routine monitoring. Apixaban and rivaroxaban are factor Xa inhibitors; dabigatran is a direct thrombin inhibitor. When levels are needed (before surgery, in major bleeding, in extremes of weight or renal function): drug-specific anti-Xa assays for Xa inhibitors; diluted thrombin time or ecarin clotting time for dabigatran. Reversal agents: andexanet alfa for apixaban/rivaroxaban; idarucizumab for dabigatran.
DIC
| Lab | DIC Pattern |
|---|---|
| Platelets | ↓↓ |
| PT/INR | ↑ |
| aPTT | ↑ |
| Fibrinogen | ↓ |
| D-dimer | ↑↑ |
| Schistocytes | Present |
| Antithrombin | ↓ |
12 Thrombophilia, vWD & HIT
Hereditary Thrombophilia Workup
| Test | Disorder | Caveat |
|---|---|---|
| Factor V Leiden (APC resistance) | Activated protein C resistance | Most common inherited thrombophilia |
| Prothrombin G20210A | Prothrombin gene mutation | Genetic test; unaffected by anticoagulation |
| Protein C activity | Protein C deficiency | Falsely low on warfarin |
| Protein S activity | Protein S deficiency | Falsely low on warfarin, pregnancy, OCPs |
| Antithrombin activity | AT deficiency | Falsely low on heparin, acute thrombosis |
| Homocysteine | Hyperhomocysteinemia | Weak risk factor |
Do not order thrombophilia testing during acute thrombosis or while anticoagulated unless you understand the caveats; many results will be falsely abnormal. The clinical impact is also limited — most testing does not change duration of anticoagulation for a first provoked VTE.
Antiphospholipid Syndrome (APS)
Requires clinical criterion (thrombosis or pregnancy morbidity) plus lab criterion: lupus anticoagulant, anti-cardiolipin IgG/IgM, or anti-β2-glycoprotein I, positive on two occasions >12 weeks apart. The lab triad of prolonged aPTT, positive lupus anticoagulant, and positive anti-cardiolipin defines triple positivity and the highest-risk phenotype.
von Willebrand Disease
| Test | Type 1 (quantitative) | Type 2 (qualitative) | Type 3 (severe) |
|---|---|---|---|
| vWF antigen | ↓ | N or ↓ | Absent |
| Ristocetin cofactor | ↓ (proportional) | ↓↓ (disproportionate) | Absent |
| Factor VIII | ↓ | Variable | Very low |
| aPTT | Normal or slightly ↑ | Variable | ↑↑ |
Heparin-Induced Thrombocytopenia (HIT)
The 4Ts score stratifies pre-test probability: Thrombocytopenia (magnitude), Timing (day 5–10 of heparin, or <1 day with recent exposure), Thrombosis or other sequelae, and oTher causes. Score 0–3 = low (<5% probability); 4–5 = intermediate; 6–8 = high. In intermediate or high pre-test probability, send anti-PF4/heparin antibodies (ELISA) and confirm positives with functional assay (serotonin release assay). Stop all heparin (including flushes) and start a non-heparin anticoagulant (argatroban, bivalirudin, fondaparinux).
Factor Assays & Specific Deficiencies
| Factor | Pathway | Deficiency Syndrome |
|---|---|---|
| I (fibrinogen) | Common | Afibrinogenemia, dysfibrinogenemia, DIC, liver failure |
| II (prothrombin) | Common | Warfarin, liver, vit K deficiency |
| V | Common | Parahemophilia; only factor not affected by warfarin; useful marker of liver synthesis |
| VII | Extrinsic | Shortest half-life; falls first on warfarin; isolated ↑PT |
| VIII | Intrinsic | Hemophilia A; X-linked; vWD (vWF carrier); acute phase reactant |
| IX | Intrinsic | Hemophilia B (Christmas disease); X-linked |
| X | Common | Amyloidosis (acquired factor X deficiency) |
| XI | Intrinsic | Hemophilia C; autosomal; bleeding milder, less predictable |
| XII | Intrinsic (contact) | Prolongs aPTT but does NOT cause bleeding; incidental finding |
| XIII | Fibrin stabilization | Delayed bleeding, umbilical stump bleeding, normal PT/aPTT |
TEG & ROTEM
Viscoelastic testing (thromboelastography or rotational thromboelastometry) provides a global assessment of clot formation, kinetics, strength, and fibrinolysis in whole blood. Increasingly used in trauma, obstetric hemorrhage, and cardiac surgery to guide goal-directed transfusion: prolonged R time (initiation) suggests need for FFP or factor concentrate; low alpha angle or MA suggests need for fibrinogen or platelets; increased LY30 suggests hyperfibrinolysis warranting tranexamic acid.
13 Sodium, Potassium & Chloride
Sodium & Tonicity
Sodium disorders are fundamentally disorders of water, not of sodium content. Classify hyponatremia by serum osmolality first, then by volume status, then by urine sodium and urine osmolality.
| Step | Test | Interpretation |
|---|---|---|
| 1 | Serum osm | Low (true hypotonic), normal (pseudo: lipids, protein), high (hypertonic: glucose, mannitol) |
| 2 | Volume status | Hypovolemic, euvolemic, hypervolemic |
| 3 | Urine osm | <100 = appropriate dilution (primary polydipsia, beer potomania); >100 = ADH active |
| 4 | Urine Na | <20 = renal retention (hypovolemia, CHF, cirrhosis); >20 = SIADH, adrenal, renal salt wasting |
Hyponatremia causes by category: hypovolemic hypotonic — GI losses, diuretics, adrenal insufficiency, cerebral salt wasting. Euvolemic hypotonic — SIADH, hypothyroidism, glucocorticoid deficiency, primary polydipsia, exercise-associated hyponatremia. Hypervolemic hypotonic — heart failure, cirrhosis, nephrotic syndrome, advanced renal failure.
Correct chronic hyponatremia slowly: no more than 8 mmol/L in 24 hours, 18 in 48 hours. Overcorrection risks osmotic demyelination syndrome (central pontine myelinolysis). Acute hyponatremia with seizures or severe symptoms can and should be corrected rapidly with 3% saline (100 mL boluses) to raise Na by 4–6 mmol/L acutely.
Hypernatremia
Always implies a water deficit (inability to access water or unable to concentrate urine). Causes: diabetes insipidus (central or nephrogenic), osmotic diuresis, insensible losses in an unconscious patient, hypertonic saline or feedings, salt poisoning. Free water deficit formula: TBW × (Na/140 − 1), where TBW = 0.6 × kg in men, 0.5 × kg in women.
Potassium
| Hyperkalemia Cause | Mechanism |
|---|---|
| Renal failure | Decreased excretion |
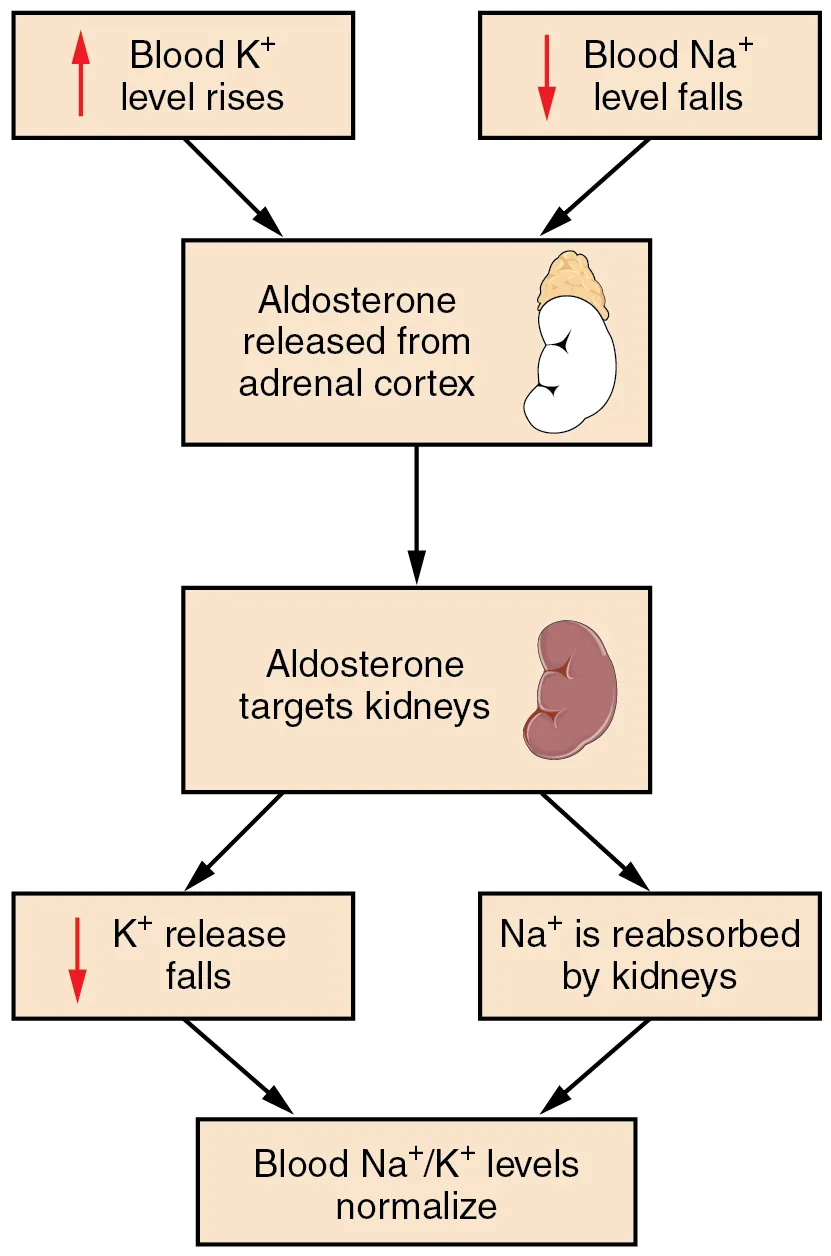
| RAAS blockade (ACEi, ARB, spironolactone) | Decreased aldosterone effect |
| Acidosis | H+/K+ exchange across cells |
| Tissue injury (rhabdo, TLS, hemolysis) | Intracellular K release |
| Insulin deficiency, beta-blocker | Impaired cellular uptake |
| Addison's disease | Aldosterone deficiency |
| Pseudohyperkalemia | Hemolysis, fist clench, EDTA contamination |
EKG progression in hyperkalemia: peaked T waves (~5.5–6.5) → PR prolongation, loss of P waves (~6.5–7.5) → wide QRS, sine wave (>8) → VF or asystole. Treat with calcium (membrane stabilization), insulin + glucose (shift), beta-agonists (shift), bicarbonate (shift, if acidotic), and removal (loop diuretics, dialysis, potassium binders).
Chloride & Bicarbonate
Chloride typically tracks with sodium but diverges in acid-base disorders. Low chloride with high bicarbonate suggests metabolic alkalosis (vomiting, diuretics); high chloride with low bicarbonate suggests normal anion gap metabolic acidosis (diarrhea, RTA, saline resuscitation).
14 Calcium, Magnesium & Phosphate
Calcium
Total calcium (normal 8.5–10.5 mg/dL) reflects both albumin-bound and free (ionized) calcium. Ionized calcium (normal 1.1–1.3 mmol/L) is the physiologically active form. Correct total calcium for albumin: corrected Ca = measured Ca + 0.8 × (4 − albumin). In critical illness, order ionized calcium directly.
| Hypercalcemia Cause | PTH | PTHrP | Vit D |
|---|---|---|---|
| Primary hyperparathyroidism | ↑ | N | N |
| Malignancy (PTHrP) | ↓ | ↑ | N |
| Malignancy (1,25-OH vit D, lymphoma) | ↓ | N | ↑ 1,25 |
| Granulomatous (sarcoid, TB) | ↓ | N | ↑ 1,25 |
| Vitamin D toxicity | ↓ | N | ↑ 25-OH |
| Thiazides | N or ↑ | N | N |
| Familial hypocalciuric hypercalcemia | N or slight ↑ | N | N; low urine Ca |
Hypocalcemia causes: hypoparathyroidism (post-thyroidectomy, autoimmune), vitamin D deficiency, chronic kidney disease, hypomagnesemia (impairs PTH release), acute pancreatitis, sepsis, citrate toxicity after massive transfusion. Symptoms include perioral numbness, Chvostek and Trousseau signs, tetany, QT prolongation, and seizures.
Magnesium
Normal 1.7–2.4 mg/dL. Hypomagnesemia is common in alcoholism, diarrhea, PPIs, loop and thiazide diuretics, aminoglycosides, refeeding syndrome. Clinically, hypomagnesemia causes refractory hypokalemia (renal K wasting) and refractory hypocalcemia (impaired PTH release) — always replace Mg before or alongside K and Ca in ICU patients. Hypermagnesemia occurs almost exclusively in renal failure or iatrogenic (eclampsia treatment); presents with hyporeflexia and respiratory depression at >10 mg/dL.
Phosphate
Normal 2.5–4.5 mg/dL. Hyperphosphatemia: renal failure, tumor lysis, rhabdomyolysis, hypoparathyroidism. Hypophosphatemia: refeeding, DKA recovery, alcoholism, respiratory alkalosis, phosphate binders, severe burns. Severe hypophosphatemia (<1 mg/dL) causes muscle weakness, respiratory failure (diaphragm), rhabdomyolysis, and hemolysis.
15 Renal Function: BUN, Creatinine & eGFR
Creatinine is produced from muscle at a relatively constant rate and cleared by glomerular filtration with a small tubular secretion component. It is the workhorse marker of renal function but is insensitive to early GFR decline and depends on muscle mass, age, sex, and ethnicity.
eGFR Equations
| Equation | Inputs | Notes |
|---|---|---|
| Cockcroft-Gault | Age, weight, sex, creatinine | Estimates creatinine clearance; used historically for drug dosing |
| MDRD | Creatinine, age, sex, race | Historically common; less accurate at high GFR |
| CKD-EPI (2021) | Creatinine, age, sex (race removed) | Current standard; most accurate across ranges |
| Cystatin C-based | Cystatin C, age, sex | Independent of muscle mass; confirmatory when creatinine is unreliable |
CKD Staging
| Stage | eGFR (mL/min/1.73m2) | Description |
|---|---|---|
| G1 | ≥90 | Normal or high; CKD only if markers present (albuminuria, imaging) |
| G2 | 60–89 | Mildly decreased |
| G3a | 45–59 | Mild–moderate |
| G3b | 30–44 | Moderate–severe |
| G4 | 15–29 | Severe; prepare for RRT |
| G5 | <15 | Kidney failure |
BUN:Creatinine Ratio
| Ratio | Interpretation |
|---|---|
| >20:1 | Pre-renal (dehydration, CHF, hemorrhage); GI bleed (protein load); steroids; high-protein diet |
| 10–20:1 | Normal / intrinsic renal disease |
| <10:1 | Low protein intake, liver failure (decreased urea synthesis), rhabdomyolysis (creatinine rises disproportionately), malnutrition, dialysis |
16 AKI vs CKD & Urine Indices
KDIGO AKI Staging
| Stage | Creatinine | Urine Output |
|---|---|---|
| 1 | ↑0.3 mg/dL in 48 hr, or 1.5–1.9× baseline | <0.5 mL/kg/hr × 6–12 hr |
| 2 | 2.0–2.9× baseline | <0.5 mL/kg/hr × ≥12 hr |
| 3 | 3.0× baseline, or ≥4 mg/dL, or RRT initiated | <0.3 mL/kg/hr × ≥24 hr or anuria × 12 hr |
Pre-Renal vs Intrinsic vs Post-Renal
| Index | Pre-Renal | Intrinsic (ATN) |
|---|---|---|
| FENa | <1% | >2% |
| FEUrea (on diuretics) | <35% | >50% |
| Urine Na | <20 | >40 |
| Urine osm | >500 | <350 (isosthenuria) |
| BUN:Cr | >20 | 10–15 |
| Sediment | Bland, hyaline casts | Muddy brown (granular) casts, RTE cells |
Formula: FENa = (UNa × PCr) / (PNa × UCr) × 100. FEUrea is preferred when diuretics are on board because they artificially raise urine sodium and invalidate FENa.
Intrinsic AKI Urinary Findings
| Finding | Cause |
|---|---|
| Muddy brown granular casts | Acute tubular necrosis |
| RBC casts | Glomerulonephritis |
| WBC casts | Pyelonephritis, acute interstitial nephritis |
| Eosinophils | Acute interstitial nephritis, atheroembolic disease |
| Hyaline casts | Normal, concentrated urine, prerenal |
| Waxy / broad casts | Chronic kidney disease |
| Crystals (uric acid) | Tumor lysis syndrome |
| Crystals (calcium oxalate) | Ethylene glycol poisoning |
17 Systematic ABG Interpretation
Every ABG should be interpreted with the same five-step algorithm. Skipping steps is the primary reason clinicians miss mixed disorders.
Step 1: Assess pH — acidemia (<7.35) or alkalemia (>7.45)?
Step 2: Identify primary disorder — metabolic (HCO3) or respiratory (PaCO2)?
Step 3: Calculate expected compensation and determine whether the compensation is appropriate.
Step 4: Calculate the anion gap. If elevated, calculate delta-delta to look for hidden disorders.
Step 5: Integrate clinically — what disease produces this pattern in this patient?
Primary Disorders & Expected Compensation
| Primary | pH | PaCO2 | HCO3 | Expected Compensation |
|---|---|---|---|---|
| Metabolic acidosis | ↓ | ↓ | ↓ | Winter's: PaCO2 = 1.5(HCO3) + 8 ± 2 |
| Metabolic alkalosis | ↑ | ↑ | ↑ | ΔPaCO2 = 0.7 × ΔHCO3 |
| Acute respiratory acidosis | ↓ | ↑ | slight ↑ | ↑HCO3 1 per 10 ↑PaCO2 |
| Chronic respiratory acidosis | near normal | ↑ | ↑ | ↑HCO3 3.5–4 per 10 ↑PaCO2 |
| Acute respiratory alkalosis | ↑ | ↓ | slight ↓ | ↓HCO3 2 per 10 ↓PaCO2 |
| Chronic respiratory alkalosis | near normal | ↓ | ↓ | ↓HCO3 4–5 per 10 ↓PaCO2 |
If the measured PaCO2 is higher than Winter's predicted value, a concurrent respiratory acidosis is present. If lower, a concurrent respiratory alkalosis is present. This is how you detect mixed disorders hidden in an apparently simple acidosis.
Oxygenation
The A–a gradient quantifies gas exchange. PAO2 = FiO2(Patm − 47) − PaCO2/0.8. On room air at sea level, PAO2 ≈ 150 − PaCO2/0.8. Normal A–a gradient < (age/4) + 4. An elevated A–a gradient indicates V/Q mismatch, shunt, or diffusion impairment; a normal A–a gradient with hypoxemia suggests hypoventilation or low FiO2.
The P/F Ratio
PaO2/FiO2 ratio is used for ARDS classification: mild 200–300, moderate 100–200, severe <100 (Berlin definition, with PEEP ≥5 cm H2O). A patient with PaO2 80 on room air (P/F = 381) is very different from a patient with PaO2 80 on FiO2 1.0 (P/F = 80) even though the PaO2 is identical.
18 Anion Gap, Delta-Delta & Mixed Disorders
Anion Gap
Anion gap = Na − (Cl + HCO3). Normal 8–12 mmol/L. Correct for albumin: add 2.5 per 1 g/dL decrease below 4. A patient with albumin 2 has a "corrected" normal AG of 13.
HAGMA — MUDPILES and GOLD MARK
| MUDPILES | GOLD MARK |
|---|---|
| Methanol | Glycols (ethylene, propylene) |
| Uremia | Oxoproline (chronic acetaminophen) |
| DKA | L-Lactate |
| Propylene glycol / paraldehyde | D-Lactate |
| Isoniazid / Iron | Methanol |
| Lactic acidosis | Aspirin |
| Ethylene glycol | Renal (uremia) |
| Salicylates / starvation | Ketones (DKA, alcoholic, starvation) |
Non-Gap (Hyperchloremic) Acidosis — HARDUPS
Hyperalimentation (TPN), Acetazolamide, RTA (types 1, 2, 4), Diarrhea, Ureterosigmoidostomy, Pancreatic fistula, Saline (large-volume normal saline resuscitation). Distinguish diarrhea from RTA with urine anion gap: UAG = (UNa + UK) − UCl. Negative UAG (−20 to −50) suggests appropriate renal ammonium excretion (diarrhea, GI loss). Positive UAG suggests impaired renal acidification (RTA).
Delta-Delta & Delta Gap
Delta ratio = (AG − 12) / (24 − HCO3). Interpretation: <0.4 pure non-gap acidosis; 0.4–1 mixed gap and non-gap; 1–2 pure gap acidosis; >2 concurrent metabolic alkalosis or pre-existing chronic respiratory acidosis (compensated high HCO3).
Patient with pH 7.30, PaCO2 30, HCO3 14, Na 140, Cl 100, K 4.0. AG = 140 − (100 + 14) = 26 (elevated, HAGMA). Winter's predicts PaCO2 = 1.5(14) + 8 = 29 ± 2 — measured 30 is appropriate. Delta ratio = (26 − 12)/(24 − 14) = 14/10 = 1.4 — suggests concurrent metabolic alkalosis on top of the HAGMA. Check chloride-responsive cause (vomiting, diuretics) before concluding.
Metabolic Alkalosis: Chloride-Responsive vs Unresponsive
| Category | Urine Cl | Causes |
|---|---|---|
| Chloride-responsive | <20 mmol/L | Vomiting, NG suction, diuretic (remote), volume contraction, post-hypercapnia |
| Chloride-resistant, hypertensive | >20 mmol/L | Primary hyperaldosteronism, Cushing's, renovascular HTN, licorice |
| Chloride-resistant, normotensive | >20 mmol/L | Bartter, Gitelman, diuretic (current use), severe K depletion, Mg depletion |
19 Liver Function Tests
"LFTs" are a misnomer — AST, ALT, ALP, and GGT are markers of hepatocyte injury or cholestasis, not function. True liver function is measured by synthetic markers: albumin, PT/INR, bilirubin (with caveats), and ammonia.
Normal Ranges & Cellular Source
| Test | Normal | Source |
|---|---|---|
| ALT | 7–55 U/L | Hepatocyte cytoplasm; liver-specific |
| AST | 8–48 U/L | Hepatocytes, muscle, heart, RBCs |
| ALP | 40–129 U/L | Bile duct epithelium, bone, placenta, intestine |
| GGT | 9–48 U/L | Bile ducts; alcohol-inducible |
| Total bilirubin | 0.1–1.2 mg/dL | Heme breakdown |
| Direct bilirubin | <0.3 mg/dL | Conjugated; water-soluble |
| Albumin | 3.5–5.0 g/dL | Synthetic; t½ ~20 days |
| PT/INR | 0.9–1.1 | Synthetic; short-half-life factors |
Hepatocellular vs Cholestatic Pattern
| Pattern | AST/ALT | ALP | Bilirubin | Causes |
|---|---|---|---|---|
| Hepatocellular | ↑↑ (>5× ULN) | N or slight ↑ | Variable | Viral, drug, ischemic, autoimmune, Wilson's |
| Cholestatic | N or slight ↑ | ↑↑ | ↑ (direct) | Stones, stricture, PBC, PSC, drugs, malignancy |
| Mixed | ↑ | ↑ | ↑ | DILI, sepsis, alcoholic hepatitis |
| Isolated ↑AST/ALT | ↑ | N | N | NAFLD, hemochromatosis, muscle injury (AST only) |
| Isolated ↑bilirubin (indirect) | N | N | ↑ indirect | Gilbert's, hemolysis |
AST:ALT Ratio
AST:ALT ratio >2 with both <300 U/L is classic for alcoholic hepatitis ("Scotch & toast" — AST for alcohol). AST:ALT >1 in non-alcoholic disease suggests cirrhosis or muscle source. ALT >AST is typical of most other hepatocellular injury (viral, NAFLD early, drug). Transaminases >1000 narrow the differential to ischemic hepatitis, acute viral hepatitis, drug (acetaminophen), autoimmune hepatitis, and Wilson's.
Bilirubin Fractionation
Indirect (unconjugated) hyperbilirubinemia: hemolysis, ineffective erythropoiesis, Gilbert's syndrome, Crigler-Najjar. Direct (conjugated) hyperbilirubinemia: biliary obstruction, hepatocellular disease, Dubin-Johnson, Rotor syndrome, sepsis. A direct fraction >50% of total bilirubin always implies hepatobiliary disease.
Disease-Specific Serology
| Condition | Key Tests |
|---|---|
| Hepatitis A | Anti-HAV IgM (acute), anti-HAV IgG (prior exposure/immunity) |
| Hepatitis B | HBsAg (active), anti-HBs (immunity), anti-HBc IgM (acute), anti-HBc IgG (past), HBeAg (high replication), HBV DNA |
| Hepatitis C | Anti-HCV (screen) → HCV RNA (confirm active); genotype for therapy |
| Autoimmune hepatitis | ANA, anti-smooth muscle, anti-LKM, elevated IgG |
| Primary biliary cholangitis | Anti-mitochondrial Ab, elevated ALP, elevated IgM |
| Primary sclerosing cholangitis | p-ANCA, MRCP findings; association with IBD |
| Hemochromatosis | Transferrin saturation >45%, ferritin ↑, HFE gene mutation |
| Wilson's disease | Low ceruloplasmin, high 24-hr urine copper, Kayser-Fleischer rings |
| α1-antitrypsin deficiency | Low A1AT level, phenotyping (PiZZ) |
Child-Pugh & MELD
Child-Pugh score uses bilirubin, albumin, INR, ascites, and encephalopathy to stratify cirrhosis (A/B/C). MELD score uses bilirubin, INR, creatinine, and sodium to prioritize liver transplant allocation: MELD-Na ≥15 is the traditional threshold for listing. Each component has pitfalls — INR differs across labs (ISI variability), creatinine underestimates dysfunction in sarcopenic patients, and bilirubin can be artifactually elevated from hemolysis.
20 Pancreatic & Cardiac Markers
Pancreatic Enzymes
Lipase (normal <160 U/L) is more specific for pancreatitis than amylase and remains elevated longer (7–14 days vs 3–5 days for amylase). Diagnosis of acute pancreatitis requires 2 of 3: characteristic abdominal pain, lipase >3× ULN, and imaging findings. The magnitude of lipase elevation does not correlate with severity. Amylase is less useful: elevated also in parotitis, small bowel obstruction, mesenteric ischemia, ruptured ectopic pregnancy, DKA, and renal failure.
Cardiac Markers
| Marker | Rises | Peaks | Returns | Uses |
|---|---|---|---|---|
| High-sensitivity troponin | 1–3 hr | 12 hr | 7–10 days | MI diagnosis, risk stratification |
| CK-MB | 3–6 hr | 24 hr | 48–72 hr | Reinfarction (because troponin stays elevated) |
| Myoglobin | 1–2 hr | 6–12 hr | 24 hr | Obsolete for MI; marker for rhabdomyolysis |
| BNP | hours | — | days | Heart failure; <100 rules out; >400 rules in |
| NT-proBNP | hours | — | days | Age-adjusted cutoffs; less affected by obesity; accumulates in CKD |
Troponin Elevation — Not Always MI
Troponin is cardiac-specific but not MI-specific. Elevation occurs in myocarditis, pericarditis, Takotsubo, sepsis, PE, heart failure exacerbation, renal failure, strenuous exercise, chemotherapy cardiotoxicity, tachyarrhythmia, and trauma. The Fourth Universal Definition of MI requires rise and/or fall of troponin with at least one value above the 99th percentile, plus ischemic symptoms, new ischemic ECG changes, new wall motion abnormality, or angiographic evidence of thrombus.
BNP & NT-proBNP Interpretation
| Situation | BNP Cutoff | NT-proBNP Cutoff |
|---|---|---|
| Rules OUT acute HF | <100 pg/mL | <300 pg/mL |
| Gray zone | 100–400 | 300–900 (<50 yr); age-adjusted above |
| Rules IN acute HF | >400 | >450 (<50), >900 (50–75), >1800 (>75) |
BNP is lower in obesity (adipose clearance) and higher in women, elderly, AFib, PE, pulmonary HTN, sepsis, and CKD. BNP is cleaved by neprilysin, so patients on sacubitril/valsartan will have artificially elevated BNP; follow NT-proBNP instead.
Other Cardiac & Inflammatory Markers
| Marker | Use |
|---|---|
| CRP | Non-specific inflammation; >10 mg/L significant; hs-CRP for CV risk |
| ESR | Slow, non-specific; useful in GCA, PMR, osteomyelitis; rises with age |
| Procalcitonin | Bacterial infection marker; guides antibiotic duration in LRTI, sepsis |
| Lactate | Tissue hypoperfusion, sepsis, ischemia, metformin, beta-agonists, seizure |
| Ferritin (as APR) | Very high (>1000) in AOSD, HLH, iron overload |
21 Lipids & Thyroid Studies
Lipid Panel
| Component | Optimal | Notes |
|---|---|---|
| Total cholesterol | <200 mg/dL | Sum of LDL + HDL + VLDL |
| LDL | <100 (very high risk <55) | Usually calculated by Friedewald; direct assay when TG >400 |
| HDL | >40 M, >50 F | Inverse CV risk |
| Triglycerides | <150 | >500 risks pancreatitis; >1000 emergent |
| Non-HDL | <130 | Total − HDL; all atherogenic particles |
| ApoB | <90 mg/dL | Particle count; superior to LDL in metabolic syndrome |
| Lp(a) | <50 mg/dL | Genetic CV risk marker; measure once |
Friedewald formula: LDL = TC − HDL − TG/5. Invalid when TG >400 or in type III dyslipidemia. For LDL <70, direct LDL is more accurate.
Thyroid Function Tests
| Pattern | TSH | Free T4 | Free T3 | Diagnosis |
|---|---|---|---|---|
| Primary hyperthyroidism | ↓↓ | ↑ | ↑ | Graves, toxic nodule, thyroiditis |
| Subclinical hyperthyroidism | ↓ | N | N | Early thyroid disease, excess replacement |
| Primary hypothyroidism | ↑↑ | ↓ | N or ↓ | Hashimoto's, iodine deficiency, post-ablation |
| Subclinical hypothyroidism | ↑ | N | N | Treat if TSH >10 or symptomatic |
| Central hypothyroidism | N or ↓ | ↓ | ↓ | Pituitary/hypothalamic disease |
| Sick euthyroid | N, ↓, or ↑ | N or ↓ | ↓↓ | Non-thyroidal illness; low T3 first |
| T3 toxicosis | ↓ | N | ↑ | Early Graves, T3-producing adenoma |
Thyroid Antibodies
TPO antibody (anti-thyroid peroxidase) — Hashimoto's thyroiditis (positive in ~95%) and Graves (~75%). TSH receptor antibody (TRAb/TSI) — Graves disease, useful in pregnancy and ambiguous presentations. Thyroglobulin antibody — present in Hashimoto's, can interfere with thyroglobulin tumor marker assays in thyroid cancer follow-up.
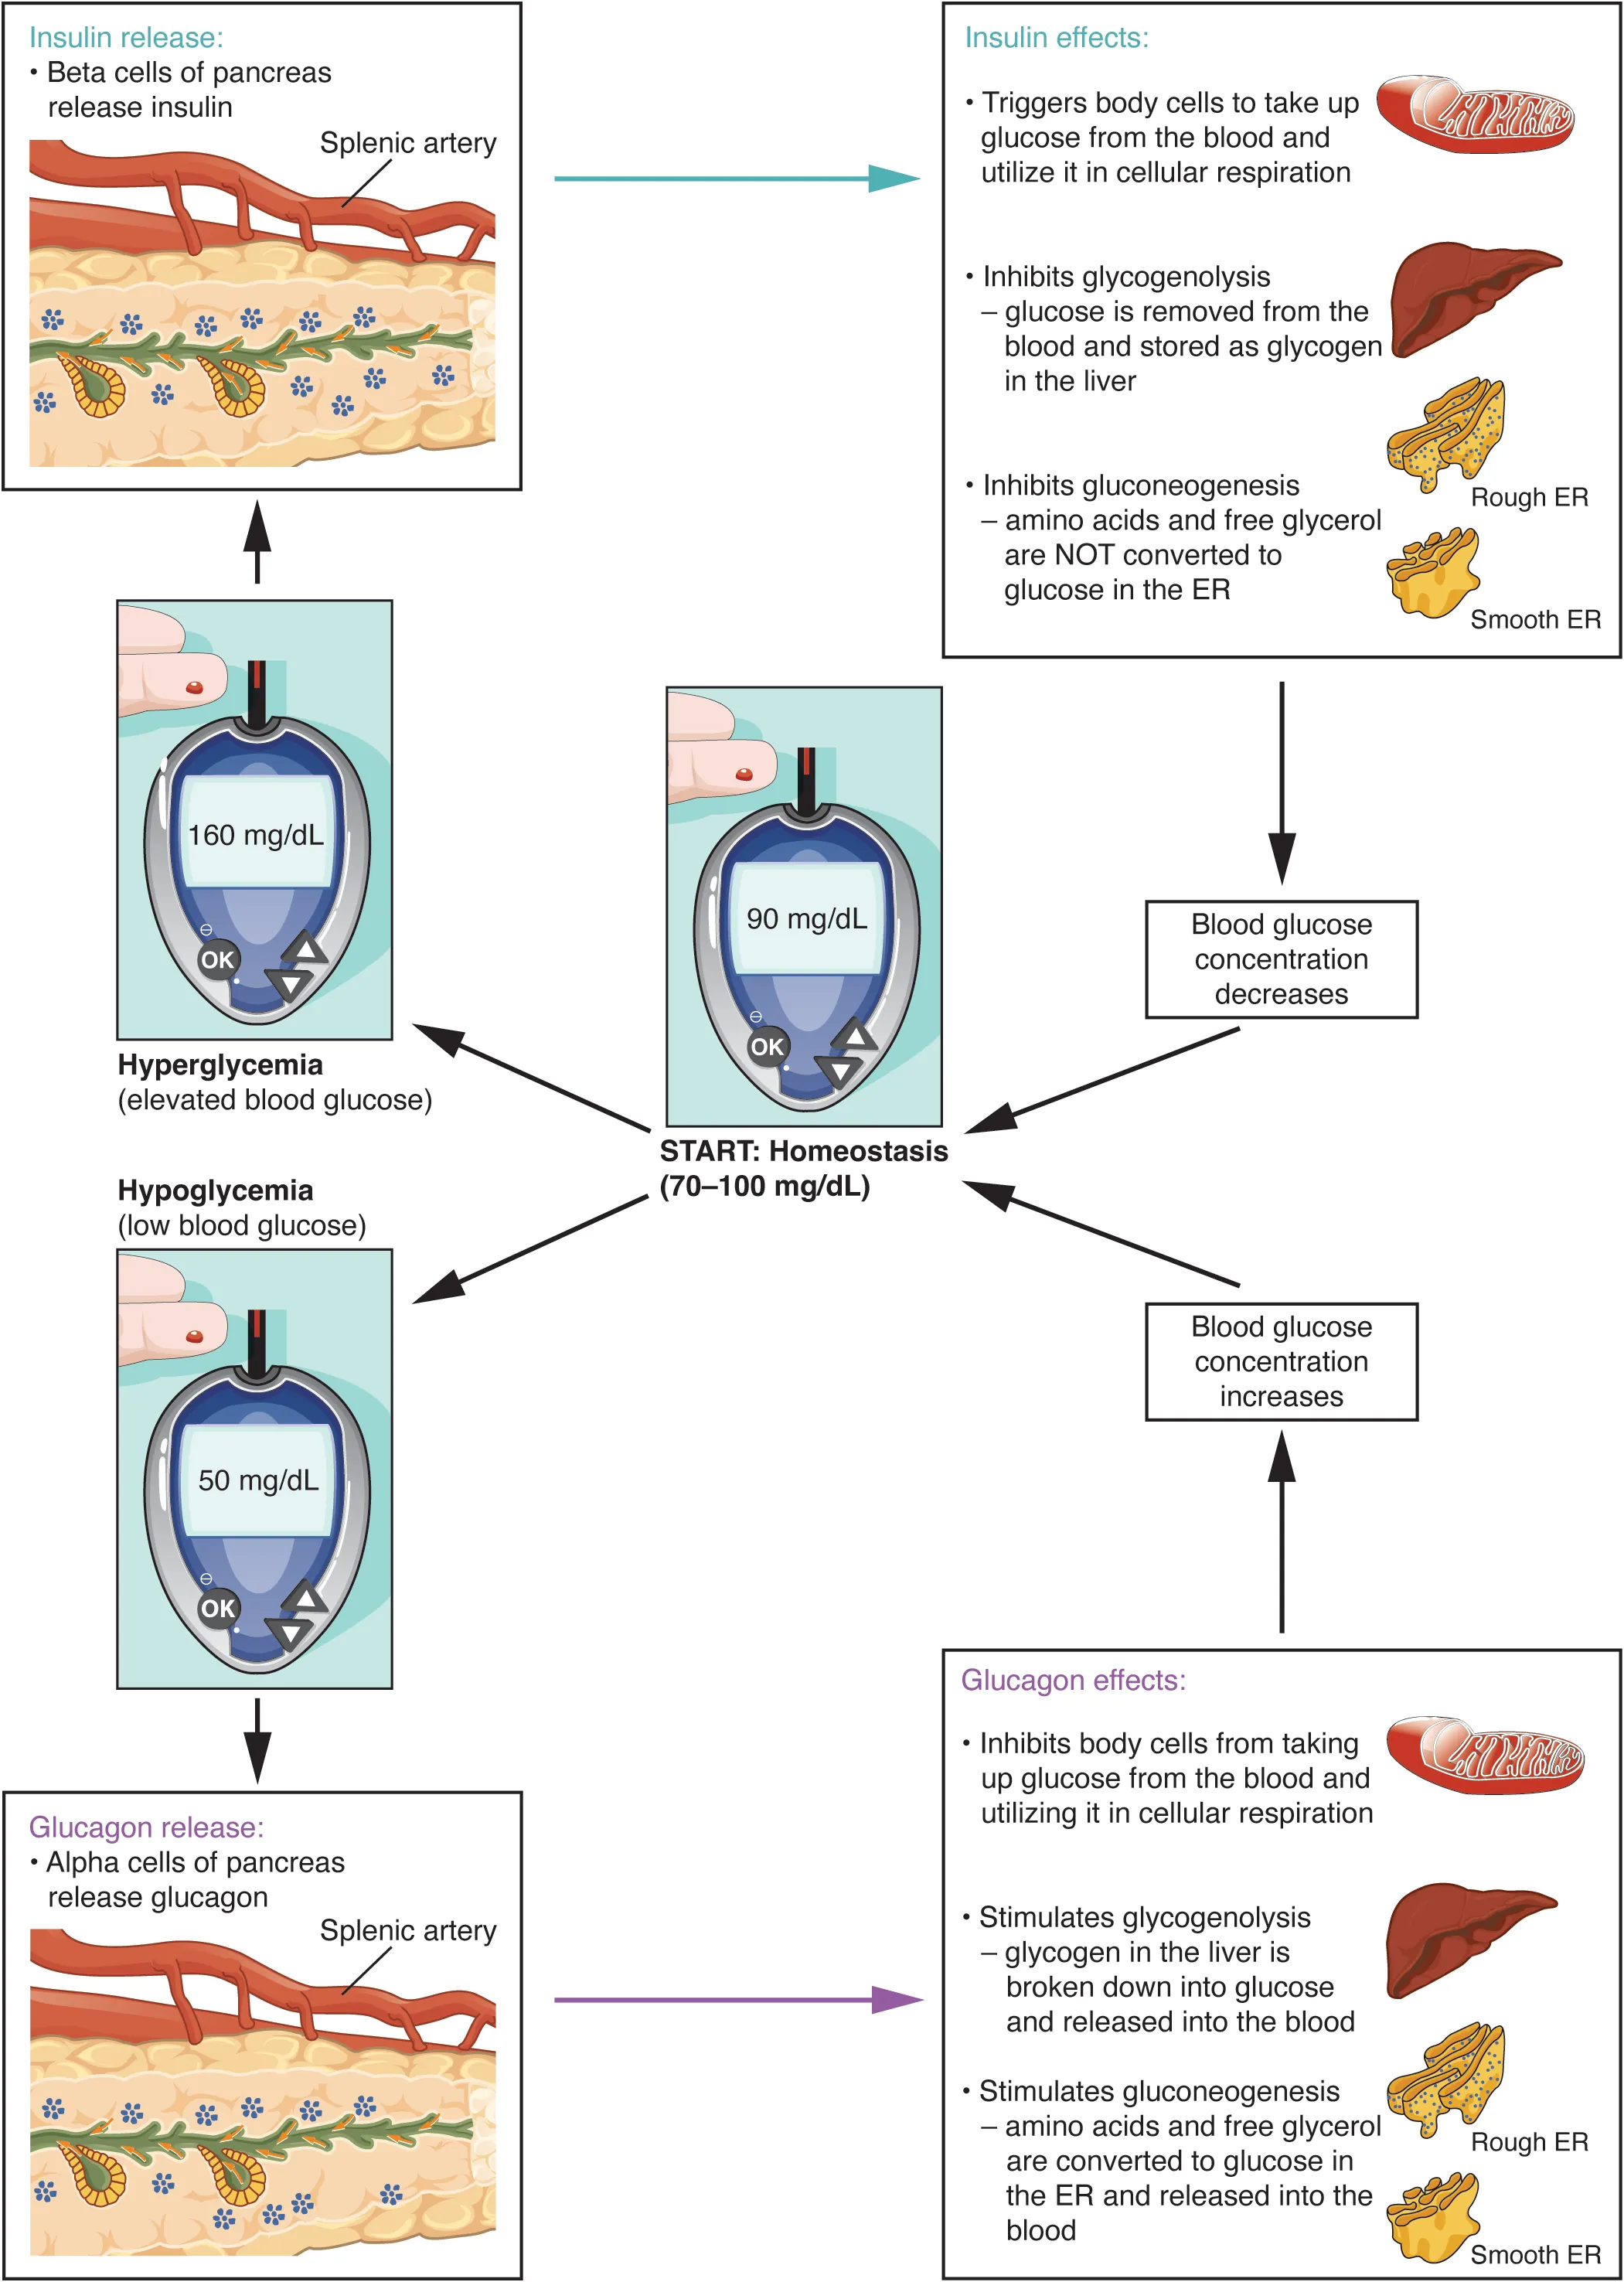
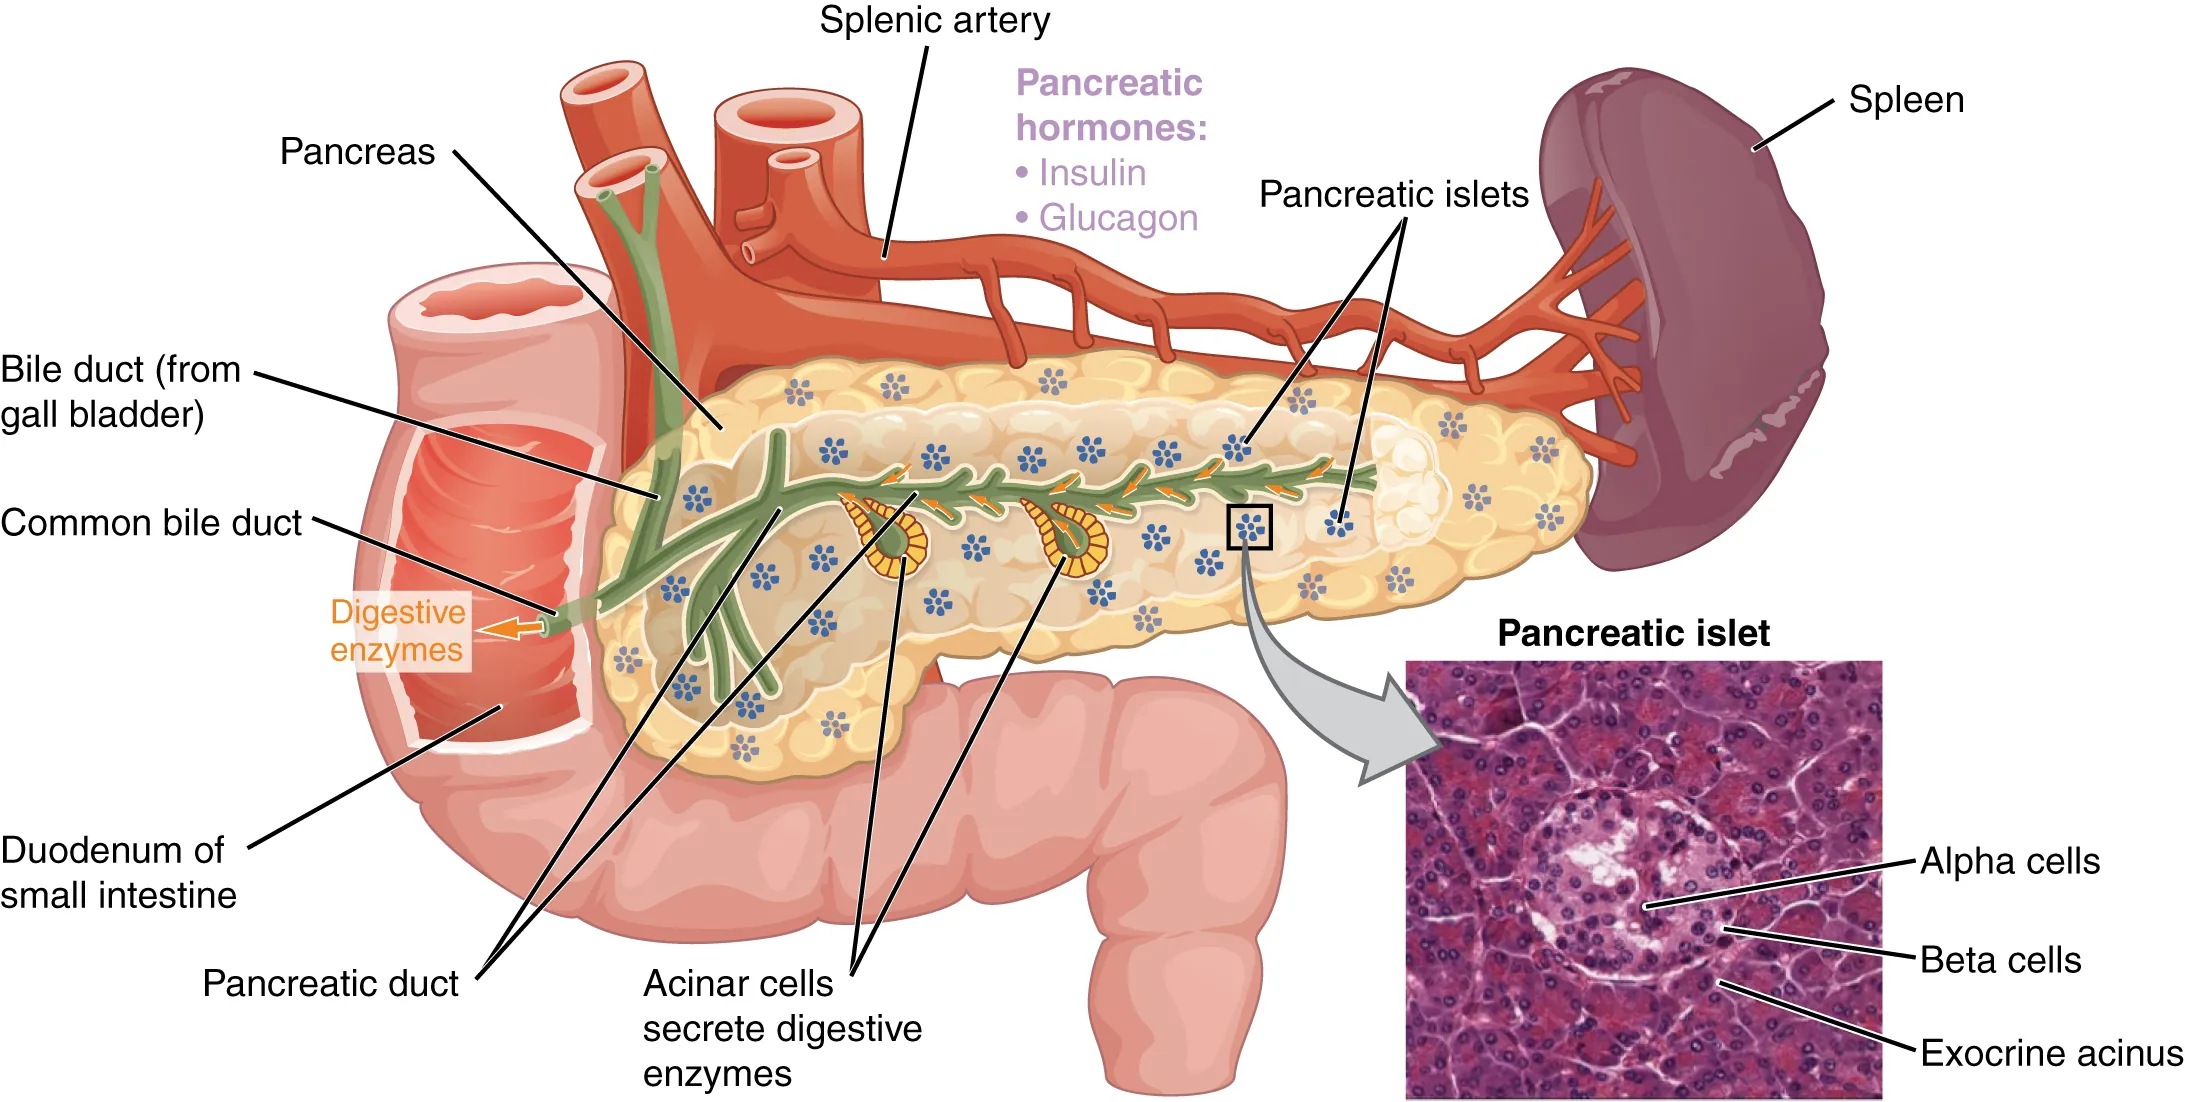
22 Diabetes & Glycemic Markers
Diagnostic Criteria (ADA)
| Test | Normal | Prediabetes | Diabetes |
|---|---|---|---|
| Fasting glucose | <100 mg/dL | 100–125 | ≥126 (confirmed) |
| 2-hr OGTT | <140 | 140–199 | ≥200 |
| HbA1c | <5.7% | 5.7–6.4% | ≥6.5% |
| Random glucose | — | — | ≥200 with symptoms |
HbA1c Pitfalls
HbA1c reflects average glucose over the prior 8–12 weeks but is unreliable in conditions that alter RBC lifespan: hemolytic anemia (falsely low), recent blood transfusion (dilutional), iron deficiency anemia (falsely high), CKD, hemoglobinopathies (HbS, HbC, HbE — depends on assay), and pregnancy. In these situations use fructosamine (2–3 week window) or continuous glucose monitoring.
Estimated Average Glucose
eAG (mg/dL) = 28.7 × A1c − 46.7. A1c 6% ≈ 126; 7% ≈ 154; 8% ≈ 183; 9% ≈ 212; 10% ≈ 240.
C-Peptide & Insulin
C-peptide distinguishes endogenous from exogenous insulin. Low C-peptide with high insulin suggests exogenous insulin (factitious, suicidal); high C-peptide with high insulin suggests insulinoma, sulfonylurea use, or insulin resistance. The 72-hour fast with measurement of glucose, insulin, C-peptide, and proinsulin remains the gold standard for insulinoma diagnosis.
DKA vs HHS
| Feature | DKA | HHS |
|---|---|---|
| Glucose | >250 | >600 |
| pH | <7.3 | >7.3 |
| Bicarbonate | <18 | >18 |
| Ketones | Moderate/large | Small |
| Anion gap | ↑ | Variable |
| Effective osm | Variable | >320 |
| Mental status | Usually alert | Altered/obtunded |
23 Adrenal, Pituitary & Bone Chemistry
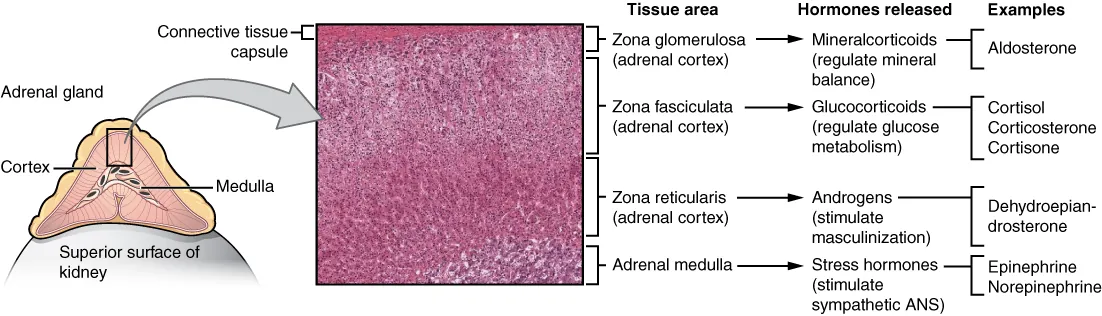
Cortisol & the HPA Axis
| Test | Use | Interpretation |
|---|---|---|
| AM cortisol | Baseline | <3 μg/dL rules in adrenal insufficiency; >15 rules out |
| ACTH stim (cosyntropin) | Primary vs central AI | Peak >18 μg/dL at 30–60 min is normal |
| Low-dose dex suppression | Screening for Cushing's | Morning cortisol <1.8 rules out; >5 abnormal |
| 24-hr urine free cortisol | Cushing's screening | >3× ULN diagnostic |
| Late-night salivary cortisol | Cushing's screening | Loss of diurnal variation |
| ACTH | Localize Cushing's | Low = adrenal; normal/high = pituitary or ectopic |
| High-dose dex suppression | Distinguish pituitary from ectopic ACTH | Pituitary suppresses; ectopic does not |
Aldosterone & Renin
Aldosterone-renin ratio (ARR) screens for primary hyperaldosteronism. ARR >20 with aldosterone >15 ng/dL suggests primary aldosteronism — confirm with saline suppression or oral salt loading. Hold spironolactone 4–6 weeks before testing; other antihypertensives have variable effects and should be adjusted if possible.
Pheochromocytoma
Best initial test is plasma free metanephrines (sensitivity >95%) or 24-hour urine metanephrines. Avoid acetaminophen before plasma sampling (assay interference). False positives from stress, TCAs, MAOIs, clonidine withdrawal, labetalol. Confirm with imaging only after biochemical confirmation.
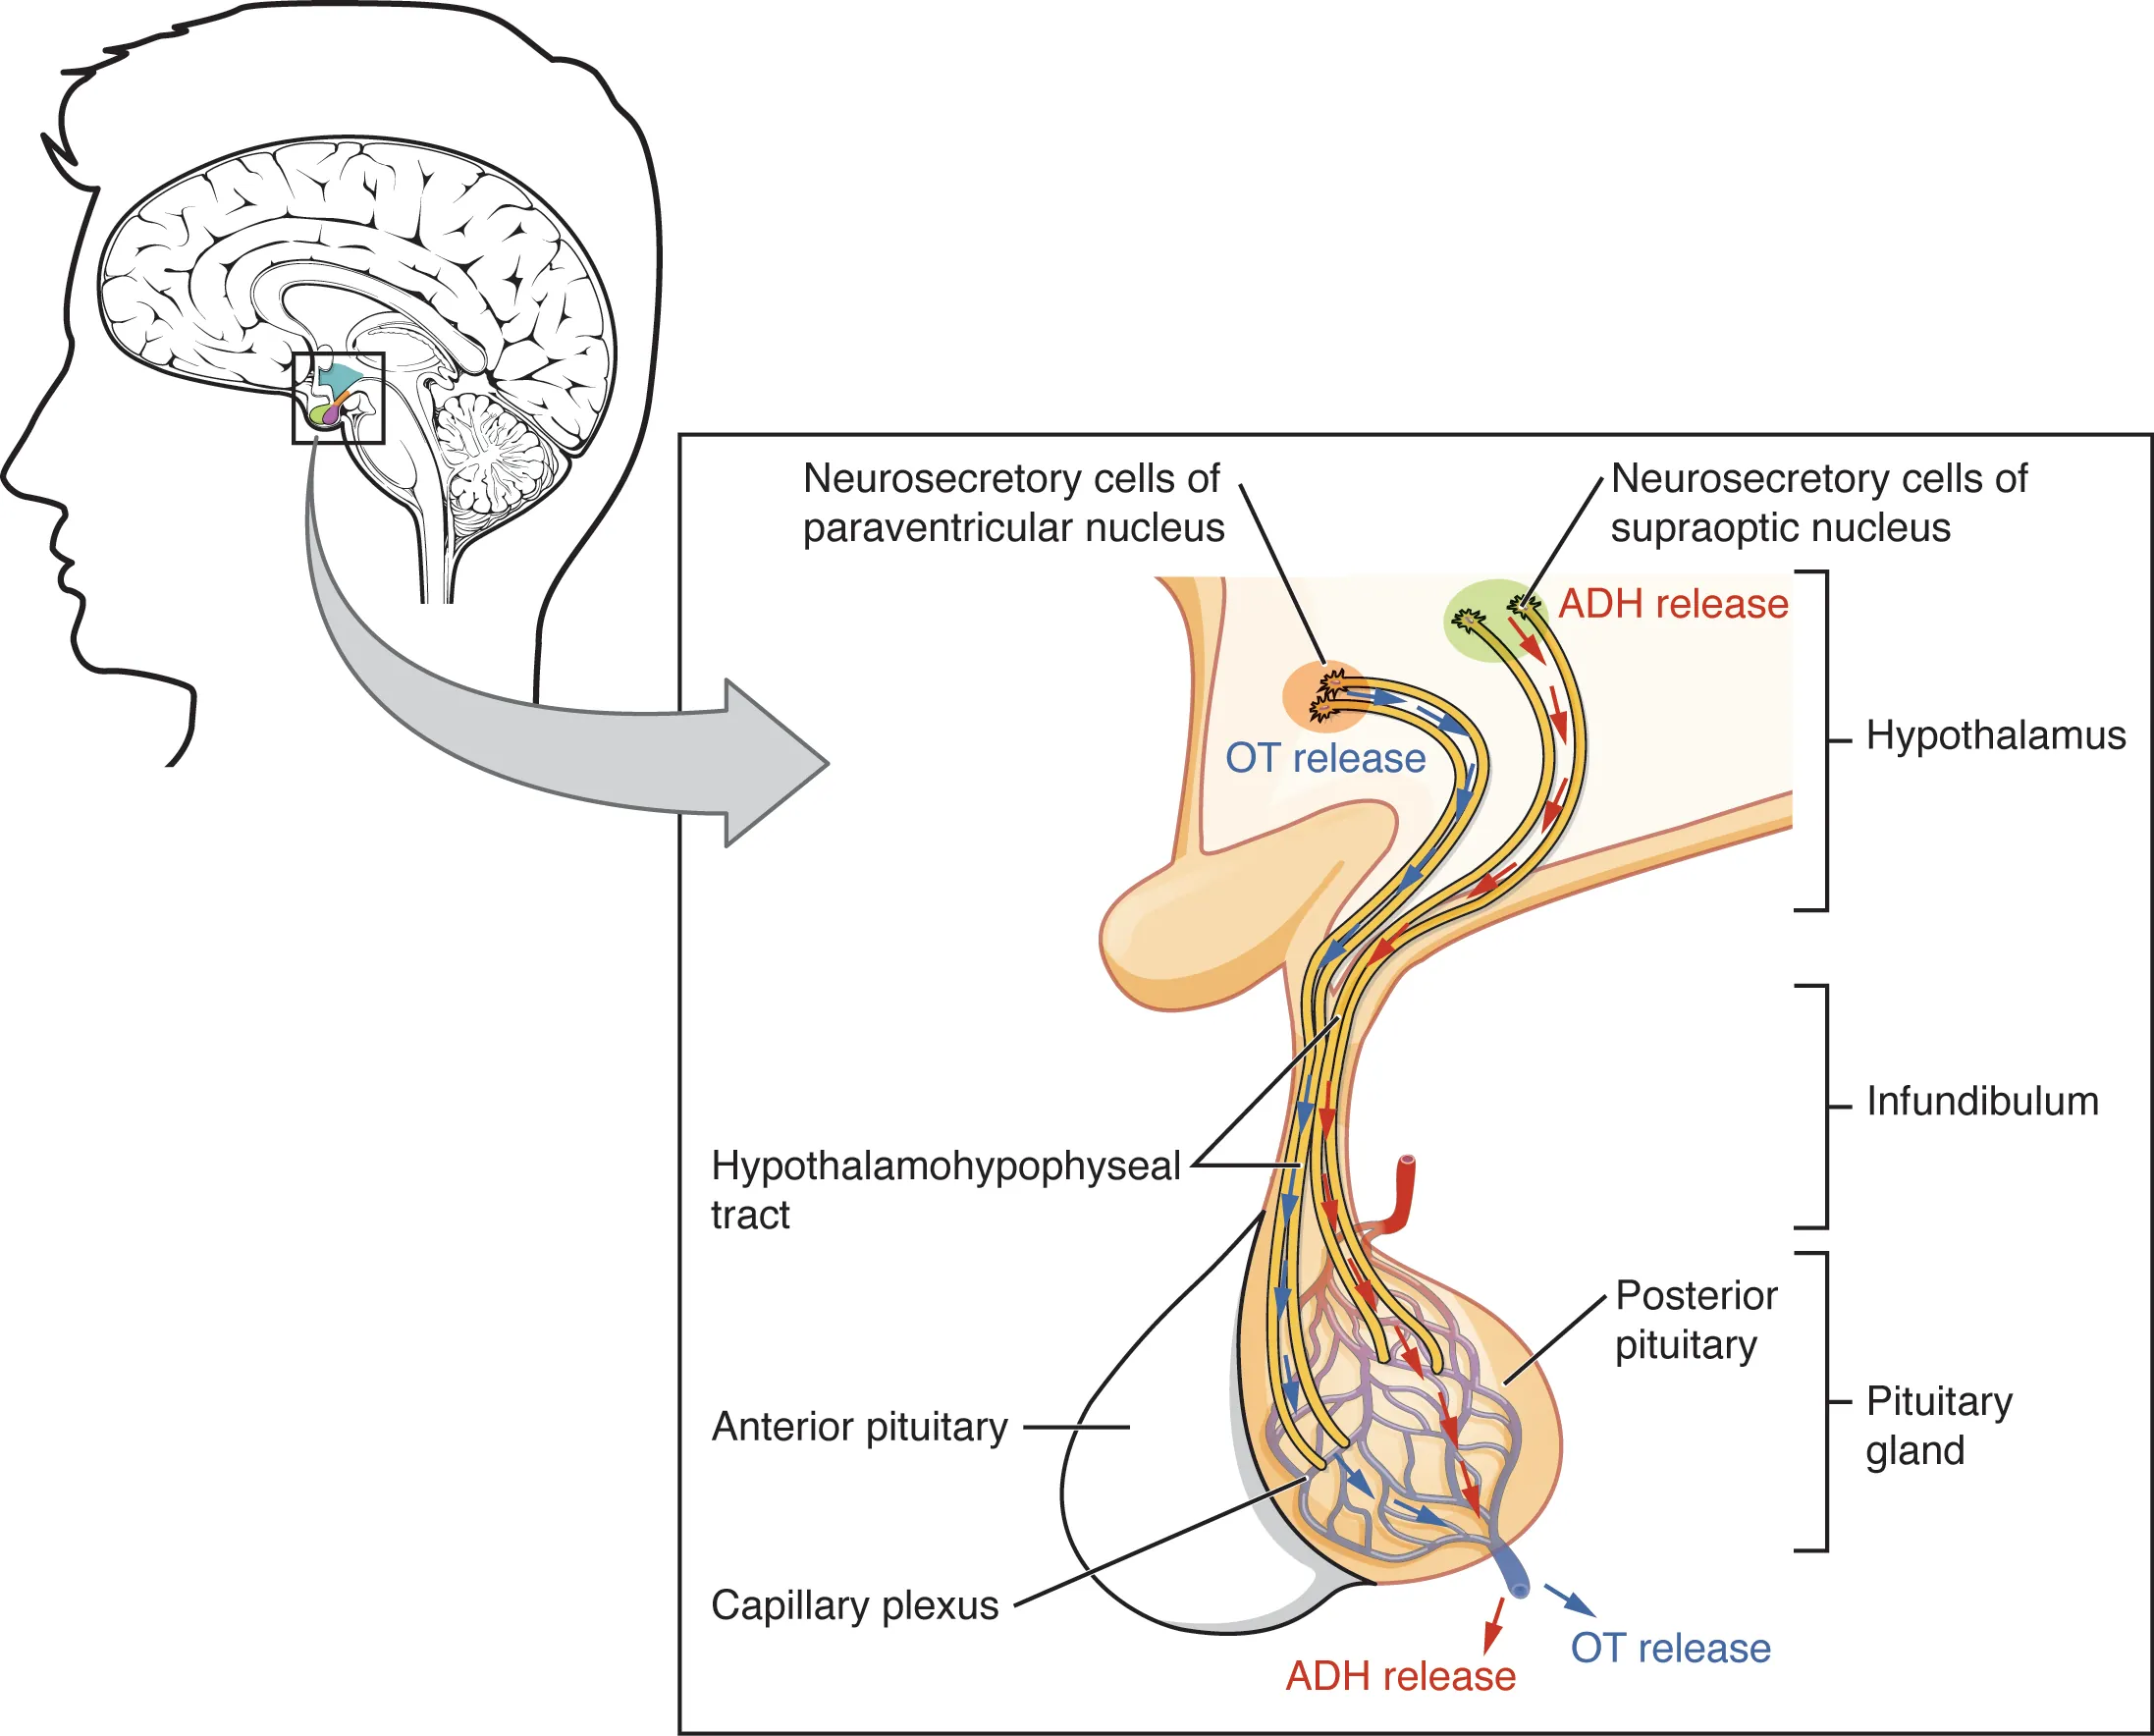
Pituitary
| Hormone | Elevated in | Low in |
|---|---|---|
| Prolactin | Prolactinoma, drugs (antipsychotics, metoclopramide), pregnancy, stress, stalk effect | Hypopituitarism |
| GH / IGF-1 | Acromegaly (confirm with OGTT failure to suppress GH) | GH deficiency |
| ACTH | Cushing's (pituitary or ectopic), primary AI | Adrenal Cushing's, secondary AI |
| FSH/LH | Primary gonadal failure, menopause | Central hypogonadism |
Calcium Homeostasis & Bone
| Scenario | Ca | Phos | PTH | 25-OH D |
|---|---|---|---|---|
| Primary hyperPTH | ↑ | ↓ | ↑ | N or ↓ |
| Secondary hyperPTH (CKD) | ↓ or N | ↑ | ↑ | ↓ |
| Vit D deficiency | ↓ or N | ↓ | ↑ | ↓ |
| Primary hypoPTH | ↓ | ↑ | ↓ | N |
| Malignancy (PTHrP) | ↑ | ↓ | ↓ | N |
Bone Turnover Markers
| Marker | Meaning |
|---|---|
| CTX (C-telopeptide) | Bone resorption; monitors antiresorptive therapy |
| NTX (N-telopeptide) | Bone resorption; urine or serum |
| P1NP | Bone formation; monitors anabolic therapy (teriparatide) |
| Osteocalcin | Bone formation; less commonly used clinically |
| Bone-specific ALP | Bone formation; useful in Paget's disease |
Sex Hormones & Reproductive Testing
| Test | Use |
|---|---|
| Total testosterone (AM) | Screen for hypogonadism; <300 ng/dL abnormal in adult men |
| Free testosterone | When SHBG altered (obesity, diabetes, thyroid disease) |
| Estradiol | Menstrual phase-dependent; low in premature ovarian insufficiency |
| Progesterone (day 21) | Confirms ovulation; >3 ng/mL |
| AMH | Ovarian reserve; independent of cycle |
| DHEA-S | Adrenal androgen; marked elevation suggests adrenal tumor in hirsutism workup |
| 17-OH progesterone | Congenital adrenal hyperplasia (21-hydroxylase deficiency) |
| β-hCG | Pregnancy, germ cell tumors, gestational trophoblastic disease |
24 Urinalysis & Microscopy
Dipstick Components
| Parameter | Normal | Abnormal Interpretation |
|---|---|---|
| Color | Pale yellow | Red (blood, myoglobin, beets, rifampin); dark (bilirubin, concentrated); milky (chyle, pus) |
| Specific gravity | 1.005–1.030 | Concentrating ability; fixed 1.010 = isosthenuria (ATN, severe CKD) |
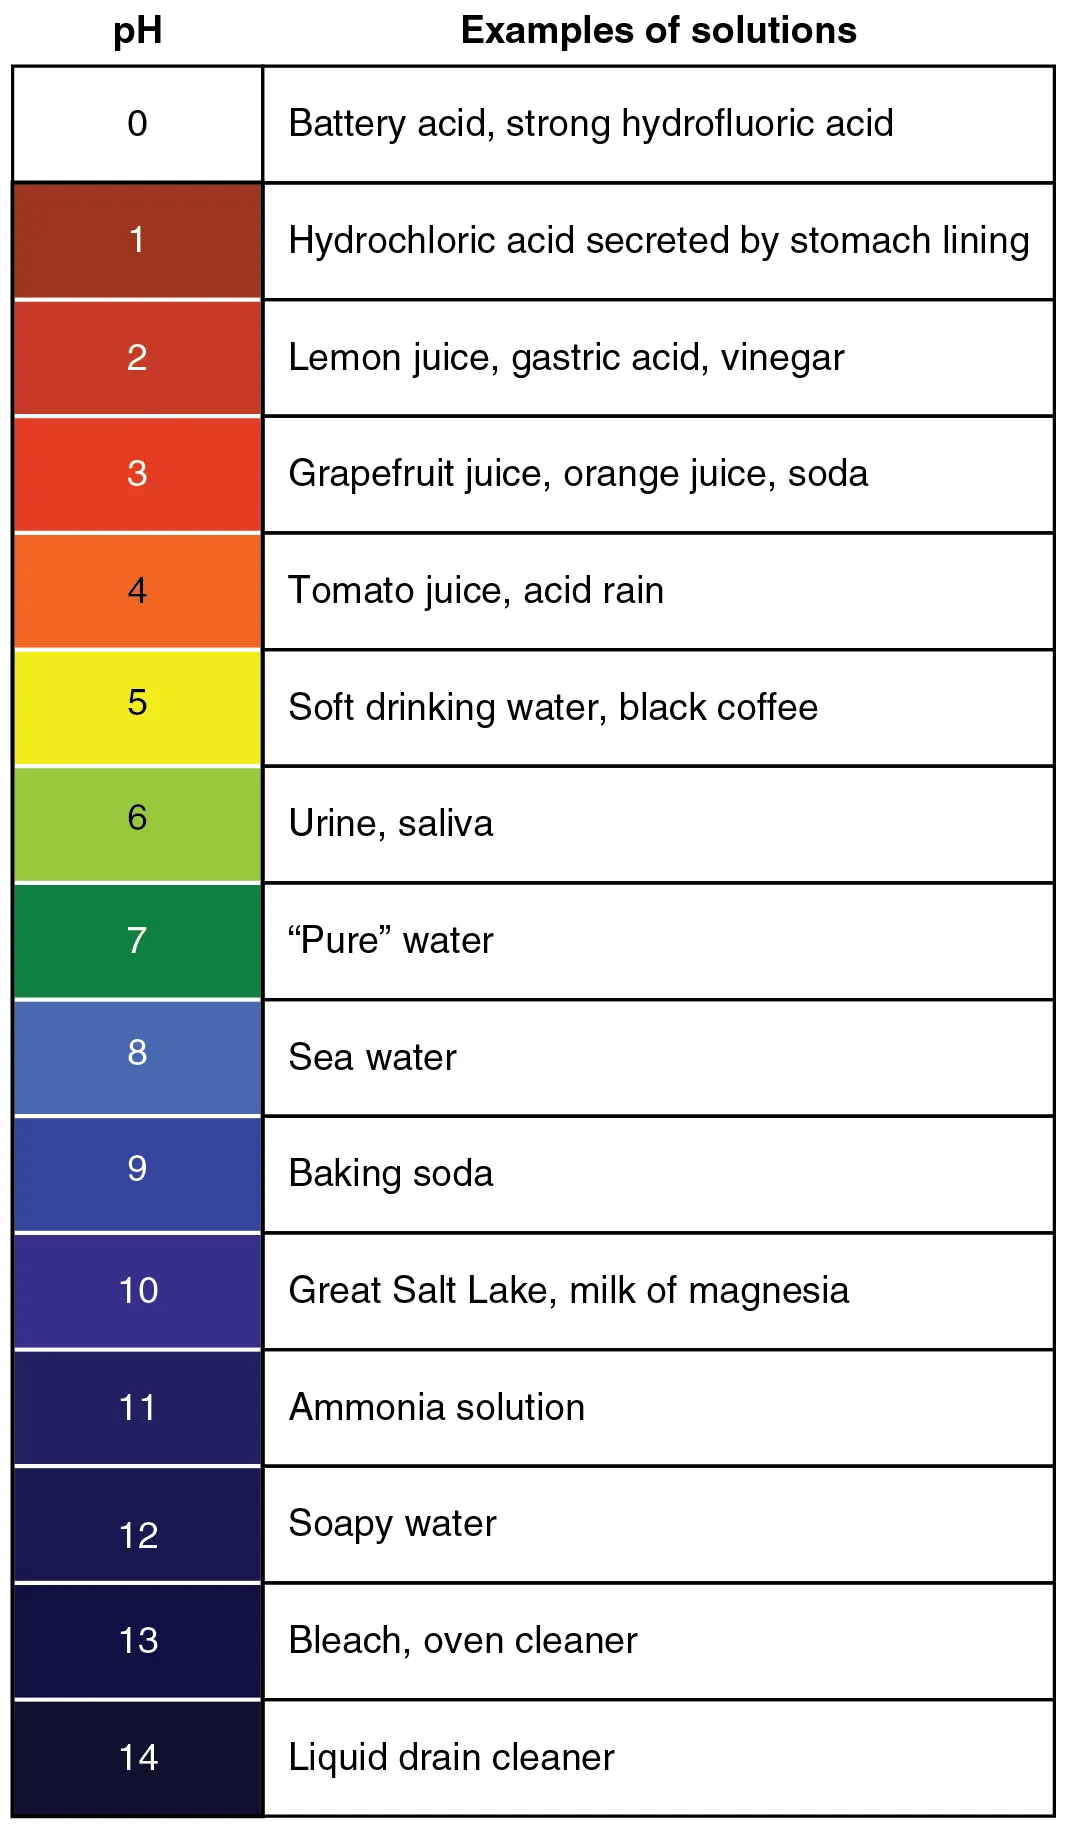
| pH | 5.0–8.0 | Persistently alkaline in UTI (urea-splitting), RTA, vegetarian diet |
| Glucose | Negative | Hyperglycemia, Fanconi, SGLT2 use, pregnancy |
| Protein | Negative / trace | Glomerular disease, orthostatic, febrile, pre-eclampsia; dipstick detects albumin mainly |
| Ketones | Negative | DKA, starvation, alcoholic ketoacidosis; detects acetoacetate, not BHB |
| Bilirubin | Negative | Direct hyperbilirubinemia (biliary obstruction, hepatocellular) |
| Urobilinogen | 0.1–1.0 | ↑ in hemolysis, hepatocellular; ↓ in complete obstruction |
| Blood | Negative | RBCs, hemoglobin, or myoglobin (positive dipstick, no RBCs on micro = pigment) |
| Leukocyte esterase | Negative | Pyuria; UTI, sterile pyuria (TB, interstitial nephritis) |
| Nitrites | Negative | Enterobacteriaceae (E. coli, Klebsiella, Proteus); gram-positives and Pseudomonas do not reduce nitrate |
Microscopy
Spin 10 mL of urine at 2000 rpm for 5 minutes, decant, and resuspend the pellet. Examine under low and high power. Normal findings include occasional hyaline casts, rare RBCs (<2/hpf), rare WBCs (<5/hpf), and squamous epithelial cells (may indicate contamination if numerous).
| Element | Significance |
|---|---|
| Dysmorphic RBCs, acanthocytes | Glomerular bleeding |
| Isomorphic RBCs | Lower tract (stones, tumor, trauma) |
| WBCs without bacteria | Sterile pyuria: TB, atypicals, interstitial nephritis, partially treated |
| Calcium oxalate (envelope) | Hypercalciuria, ethylene glycol poisoning |
| Uric acid (rhomboid) | Gout, tumor lysis, low urine pH |
| Struvite (coffin lid) | Urease-producing infection (Proteus, Klebsiella) |
| Cystine (hexagonal) | Cystinuria |
| Yeast | Candiduria; colonization vs infection |
Proteinuria Quantification
Dipstick is semiquantitative and detects mainly albumin. Quantify with urine protein:creatinine ratio (spot sample approximates 24-hr protein in g/day) or urine albumin:creatinine ratio for microalbuminuria screening. Normal <30 mg/g; microalbuminuria 30–300; macroalbuminuria >300. Nephrotic range proteinuria >3.5 g/day.
25 Gram Stain & Culture Interpretation
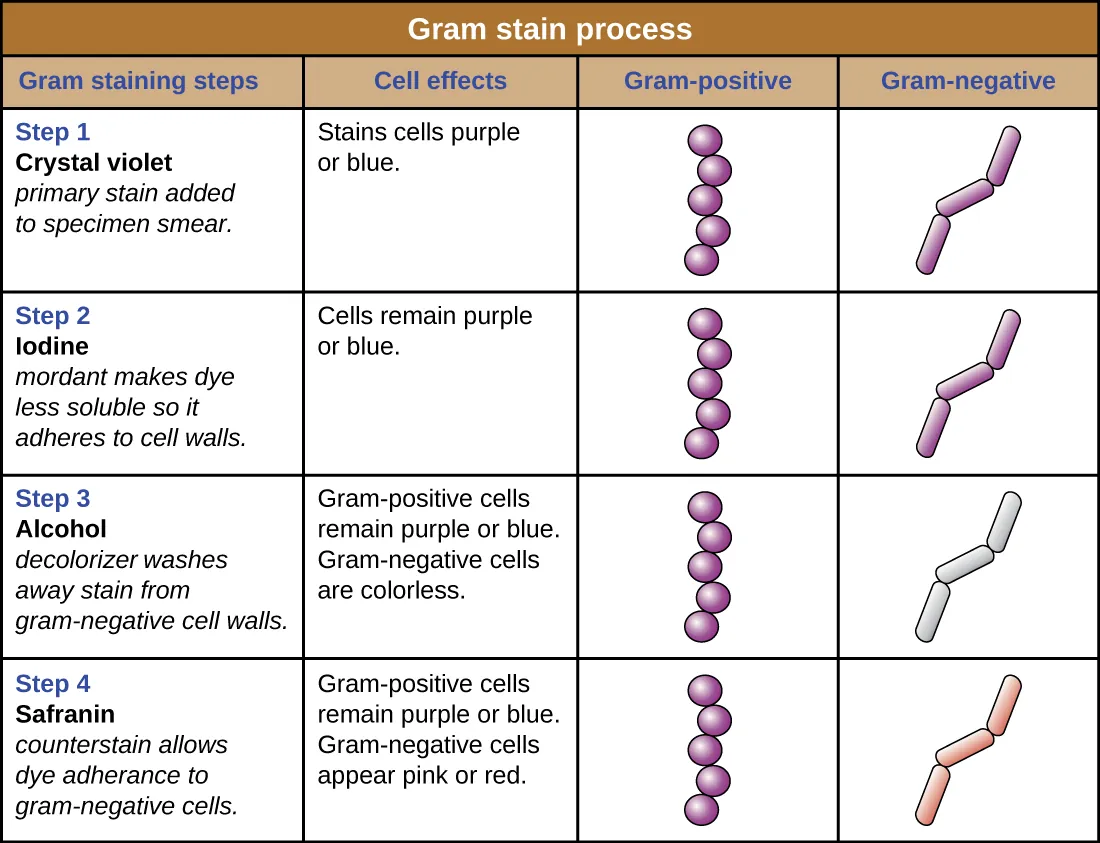
Gram Stain Morphology
| Morphology | Common Organisms |
|---|---|
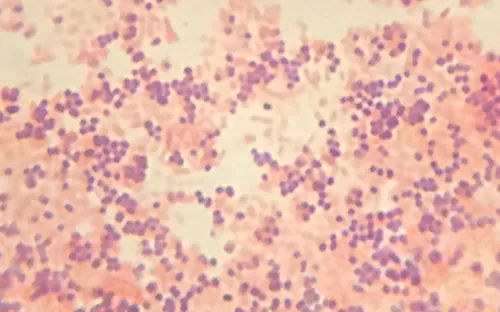
| Gram-positive cocci in clusters | Staphylococcus (aureus, epidermidis) |
| Gram-positive cocci in chains/pairs | Streptococcus, Enterococcus |
| Gram-positive diplococci, lancet-shaped | Streptococcus pneumoniae |
| Gram-positive rods | Listeria, Corynebacterium, Bacillus, Clostridium |
| Gram-negative diplococci | Neisseria (meningitidis, gonorrhoeae), Moraxella |
| Gram-negative rods | Enterobacteriaceae (E. coli, Klebsiella), Pseudomonas |
| Gram-negative coccobacilli | Haemophilus, Bordetella, Acinetobacter |
| Gram-variable / pleomorphic | Gardnerella, Haemophilus |
Blood Culture Interpretation
Standard practice: 2 sets (aerobic + anaerobic, 20 mL each) drawn from separate sites before antibiotics. Time to positivity <12 hours with high-grade organisms suggests true bacteremia; delayed growth at 48–72 hours often represents contamination or low-inoculum organisms. Persistent bacteremia with S. aureus, Candida, or HACEK organisms always warrants endocarditis evaluation.
| Organism | True Pathogen vs Contaminant |
|---|---|
| S. aureus | Always a pathogen in blood |
| S. pneumoniae | Always a pathogen |
| Gram-negative rods | Almost always pathogens |
| Coagulase-negative Staph | Usually contaminant; pathogen in prosthetics, line infection |
| Bacillus (not anthracis) | Usually contaminant |
| Corynebacterium (non-diphtheriae) | Usually contaminant; pathogen in prosthetics |
| Cutibacterium acnes | Usually contaminant; pathogen in prosthetic joints, shunts |
Urine Culture Thresholds
| Scenario | Significant Threshold |
|---|---|
| Clean-catch, symptomatic female | ≥105 CFU/mL (traditional); ≥102 if pyuria and symptoms |
| Symptomatic male | ≥103 CFU/mL |
| Catheterized | ≥103 CFU/mL |
| Suprapubic aspirate | Any growth |
| Asymptomatic bacteriuria | ≥105 in 2 consecutive samples; do not treat except pregnancy, pre-urologic procedure |
26 CSF & Body Fluid Analysis
CSF Reference Values
| Parameter | Normal | Bacterial | Viral | Fungal/TB |
|---|---|---|---|---|
| Opening pressure | 10–20 cm H2O | ↑↑ | N or slight ↑ | ↑ |
| WBC | <5/μL | >1000 (PMNs) | 10–500 (lymph) | 100–500 (lymph) |
| Protein | 15–45 mg/dL | >100 | N or slight ↑ | >100 |
| Glucose | >60% serum (40–70) | <40% serum | Normal | <40% serum |
| Gram stain | Negative | Positive ~60–90% | Negative | Negative (AFB or India ink) |
CSF collected in 4 tubes traditionally: tube 1 cell count and chemistries, tube 2 microbiology, tube 3 special studies, tube 4 second cell count (to compare RBC counts for traumatic tap vs SAH). In traumatic tap, RBCs decrease tube 1 to tube 4; in SAH, they remain the same and xanthochromia develops after ~4–12 hours.
Pleural Fluid — Light's Criteria
Exudate if any one of: pleural protein/serum protein >0.5, pleural LDH/serum LDH >0.6, or pleural LDH >2/3 ULN of serum LDH. Transudates are typically bilateral and due to CHF, cirrhosis, or nephrotic syndrome. Exudates suggest infection, malignancy, PE, autoimmune, or pancreatitis. Additional useful tests: pH <7.2 suggests empyema or complicated parapneumonic effusion requiring drainage; glucose <60 in effusion suggests rheumatoid, empyema, TB, or malignancy; amylase ↑ in pancreatitis and esophageal rupture; triglycerides >110 mg/dL in chylothorax.
Ascitic Fluid — SAAG
Serum-ascites albumin gradient = serum albumin − ascites albumin. SAAG ≥1.1 g/dL indicates portal hypertension (cirrhosis, heart failure, Budd-Chiari, massive liver mets); SAAG <1.1 suggests non-portal etiology (peritoneal carcinomatosis, TB peritonitis, pancreatic ascites, nephrotic syndrome). In suspected spontaneous bacterial peritonitis (SBP), PMN count ≥250/μL is diagnostic — treat empirically with 3rd-generation cephalosporin while awaiting culture.
Synovial Fluid
| Class | Appearance | WBC | PMN% | Examples |
|---|---|---|---|---|
| Normal | Clear | <200 | <25% | — |
| Non-inflammatory (I) | Clear yellow | 200–2000 | <25% | OA, trauma |
| Inflammatory (II) | Cloudy | 2000–50,000 | >50% | Gout, pseudogout, RA, SLE |
| Septic (III) | Purulent | >50,000 (often >100k) | >75% | Bacterial arthritis |
| Hemorrhagic (IV) | Bloody | Varies | Varies | Trauma, coagulopathy, PVNS |
Crystal analysis under polarized light: monosodium urate (gout) = needle-shaped, negatively birefringent, yellow when parallel to axis. Calcium pyrophosphate (pseudogout) = rhomboid, positively birefringent, blue when parallel to axis.
Autoimmune Serology Quick Reference
| Antibody | Disease Association |
|---|---|
| ANA | SLE screen (sensitive, not specific); positive in many autoimmune and healthy people |
| Anti-dsDNA | SLE (specific); tracks disease activity, renal involvement |
| Anti-Smith | SLE (highly specific, low sensitivity) |
| Anti-Ro (SSA) / La (SSB) | Sjögren's, SLE, neonatal lupus, congenital heart block |
| Anti-histone | Drug-induced lupus (hydralazine, procainamide, INH) |
| Anti-centromere | Limited scleroderma (CREST) |
| Anti-Scl-70 (topoisomerase) | Diffuse scleroderma |
| Anti-Jo-1 | Polymyositis/dermatomyositis with ILD |
| Anti-CCP | Rheumatoid arthritis (more specific than RF) |
| RF | RA; also Sjögren's, cryoglobulinemia, hepatitis C |
| c-ANCA (PR3) | Granulomatosis with polyangiitis |
| p-ANCA (MPO) | Microscopic polyangiitis, EGPA, drug-induced |
| Anti-GBM | Goodpasture syndrome |
| Anti-phospholipid (LA, aCL, β2GPI) | Antiphospholipid syndrome |
| Anti-TTG IgA | Celiac disease (with total IgA to rule out deficiency) |
Tumor Markers
| Marker | Use | Caveats |
|---|---|---|
| PSA | Prostate cancer screening/monitoring | BPH, prostatitis, trauma elevate |
| CEA | Colon cancer surveillance | Smoking, IBD, pancreatitis elevate |
| CA 19-9 | Pancreatic, biliary cancer | Lewis-negative patients don't produce; elevated in cholestasis |
| CA-125 | Ovarian cancer surveillance | Menstruation, endometriosis, PID, cirrhosis elevate |
| AFP | HCC, germ cell tumors | Pregnancy, hepatitis elevate |
| β-hCG | Germ cell tumors, GTD, pregnancy | — |
| LDH | Lymphoma, germ cell tumor prognosis | Non-specific |
| Thyroglobulin | Thyroid cancer recurrence (post-thyroidectomy) | Interference from anti-thyroglobulin antibodies |
| Chromogranin A | Neuroendocrine tumors | PPI use elevates |
27 Toxicology Screens & Drug Levels
Urine Drug Screen (Immunoassay)
| Target | Detection Window | False Positives | False Negatives |
|---|---|---|---|
| Amphetamines | 2–4 days | Pseudoephedrine, bupropion, selegiline, trazodone, labetalol | MDMA may not cross-react |
| Cocaine (benzoylecgonine) | 2–4 days | Very few; highly specific | — |
| Opiates | 2–3 days | Poppy seeds, quinolones, rifampin | Does not detect oxycodone, methadone, fentanyl, tramadol, buprenorphine |
| Benzodiazepines | 3–30 days | Sertraline, oxaprozin | Misses clonazepam, lorazepam on some assays |
| Cannabinoids (THC) | 3–30+ days (chronic) | Dronabinol, PPIs, efavirenz | Synthetic cannabinoids not detected |
| PCP | 7–14 days | Ketamine, dextromethorphan, venlafaxine, tramadol | — |
| Methadone | 3–7 days | Quetiapine, verapamil, diphenhydramine | — |
Acetaminophen & Salicylates
Acetaminophen level at 4 hours post-ingestion plotted on the Rumack-Matthew nomogram determines N-acetylcysteine therapy. Treat above the treatment line (>150 μg/mL at 4 hours). For staggered ingestions or unknown timing, treat empirically. Salicylate level: therapeutic 10–30 mg/dL; toxicity >40; severe >80. Mixed respiratory alkalosis (early) + anion gap metabolic acidosis (later) is pathognomonic.
Therapeutic Drug Monitoring
| Drug | Trough / Peak | Target |
|---|---|---|
| Vancomycin | Trough (AUC-based preferred) | Trough 15–20 mg/L (serious infection); AUC 400–600 |
| Gentamicin (conventional) | Peak / trough | Peak 5–10; trough <2 |
| Gentamicin (extended-interval) | Random level, Hartford nomogram | — |
| Tobramycin | Same as gentamicin | — |
| Amikacin | Peak 20–30; trough <5 | — |
| Digoxin | Trough (>6 hr post dose) | 0.5–2.0 ng/mL; >2.0 toxic |
| Lithium | Trough (12 hr) | 0.6–1.2 mEq/L; >1.5 toxic |
| Phenytoin | Trough | 10–20 μg/mL (free 1–2); correct for albumin |
| Valproate | Trough | 50–100 μg/mL |
| Carbamazepine | Trough | 4–12 μg/mL |
| Tacrolimus | Trough | 5–20 ng/mL (indication-specific) |
| Cyclosporine | Trough | 100–300 ng/mL |
| Sirolimus | Trough | 5–15 ng/mL |
| Theophylline | Level | 5–15 μg/mL |
Antiepileptic & Immunosuppressant Monitoring
Phenytoin is heavily protein-bound. In hypoalbuminemia (common in hospitalized patients), the total level underestimates the free (active) drug. Correct: corrected phenytoin = measured / (0.2 × albumin + 0.1). In severe hypoalbuminemia or renal failure, measure free phenytoin directly.
Osmolar Gap & Toxic Alcohols
Calculated osm = 2(Na) + glucose/18 + BUN/2.8 + ethanol/4.6. Osmolar gap = measured − calculated. Normal <10. Elevated in methanol, ethylene glycol, isopropanol, mannitol, propylene glycol, and severe ketoacidosis. Combination of elevated anion gap + elevated osmolar gap + metabolic acidosis suggests toxic alcohol poisoning — treat with fomepizole and consider dialysis.
28 Critical Values, Formulas & Reference
Master Formula Reference
| Formula | Calculation |
|---|---|
| Anion gap | Na − (Cl + HCO3); normal 8–12 |
| Corrected AG (albumin) | AG + 2.5 × (4 − albumin) |
| Delta ratio | (AG − 12) / (24 − HCO3) |
| Winter's formula | PaCO2 = 1.5(HCO3) + 8 ± 2 |
| Serum osmolality | 2(Na) + Glc/18 + BUN/2.8 |
| Osmolar gap | Measured osm − calculated osm (normal <10) |
| Corrected Na (hyperglycemia) | Measured Na + 1.6 × (Glc − 100)/100 |
| Corrected Ca (albumin) | Ca + 0.8 × (4 − albumin) |
| Free water deficit | TBW × (Na/140 − 1); TBW = 0.6 × kg (M), 0.5 × kg (F) |
| FENa | (UNa × PCr) / (PNa × UCr) × 100 |
| FEUrea | (UUrea × PCr) / (PUrea × UCr) × 100 |
| Cockcroft-Gault CrCl | [(140 − age) × weight] / (72 × Cr); × 0.85 if female |
| Corrected reticulocyte | Retic% × (Hct / 45) |
| Mentzer index | MCV / RBC count; >13 IDA, <13 thalassemia |
| Friedewald LDL | TC − HDL − TG/5 (invalid if TG >400) |
| A–a gradient | PAO2 − PaO2; normal < (age/4) + 4 |
| P/F ratio | PaO2 / FiO2 |
| eAG from A1c | 28.7 × A1c − 46.7 |
| Corrected phenytoin | Measured / (0.2 × albumin + 0.1) |
Quick Reference — Expected Compensation
| Disorder | Expected |
|---|---|
| Metabolic acidosis | ↓PaCO2 = 1.2 × ↓HCO3 |
| Metabolic alkalosis | ↑PaCO2 = 0.7 × ↑HCO3 |
| Acute respiratory acidosis | ↑HCO3 = 1 per 10 ↑PaCO2 |
| Chronic respiratory acidosis | ↑HCO3 = 3.5 per 10 ↑PaCO2 |
| Acute respiratory alkalosis | ↓HCO3 = 2 per 10 ↓PaCO2 |
| Chronic respiratory alkalosis | ↓HCO3 = 5 per 10 ↓PaCO2 |
High-Yield Clinical Pearls
1. Never act on a critical value without looking at the patient — pre-analytic error is the single most common cause of spurious panic values.
2. Always correct: calcium for albumin, sodium for glucose, phenytoin for albumin, reticulocytes for hematocrit, anion gap for albumin.
3. The peripheral smear is faster and cheaper than any molecular test and frequently provides the diagnosis before the panel returns.
4. Trend matters more than absolute value — one creatinine is a data point; three creatinines are a diagnosis.
5. Test characteristics depend on pre-test probability. A test that rules out disease in a low-probability patient may be useless in a high-probability patient.
6. Every elevated lactate, troponin, or d-dimer has a differential beyond its textbook cause; do not anchor on a single mechanism.
7. Repeat before you react — especially for borderline potassium, calcium, and thyroid function values.
8. Reference ranges are statistical, not physiological: 1 in 20 "abnormal" results in healthy people is expected.
9. Know the assay limitations of every test you order — HbA1c in hemoglobinopathy, troponin in CKD, d-dimer in pregnancy, phenytoin in hypoalbuminemia.
10. When the labs do not fit the clinical picture, doubt the labs first — but never long.
Critical Value Callback Checklist
| Value | Immediate Action |
|---|---|
| K >6.5 | ECG, calcium gluconate, insulin/glucose, albuterol, repeat K |
| K <2.5 | ECG, IV K replacement (peripheral max 10 mEq/hr), check Mg |
| Na <120 (symptomatic) | 3% saline bolus; correct <8 mmol/L/24 hr |
| Glucose <40 | D50 1 amp IV; recheck in 15 min; address cause |
| Glucose >500 + acidosis | DKA/HHS protocol; IV fluids, insulin drip, K replacement |
| Hb <6.5 | Type and cross, transfuse (unless chronic stable) |
| Platelets <10 | Transfuse if bleeding or before procedure; not in TTP/HIT |
| INR >5 (no bleeding) | Hold warfarin; oral vit K 2.5–5 mg |
| INR >5 (bleeding) | 4F-PCC + IV vit K 10 mg |
| pH <7.2 | Identify cause; treat underlying; consider bicarb in severe acidemia |
| Lactate >4 | Resuscitate, source control, sepsis bundle |
| Troponin rising + ACS | Aspirin, heparin, cath lab evaluation |
| Ca >14 | IV fluids, calcitonin, bisphosphonate; treat cause |
| Ca <7 | IV calcium gluconate if symptomatic; replace Mg |
| Ammonia >100 + encephalopathy | Lactulose, rifaximin; identify precipitant |
Abbreviations
ABG = arterial blood gas; ACD = anemia of chronic disease; ACTH = adrenocorticotropic hormone; ADAMTS13 = von Willebrand factor-cleaving protease; AFP = alpha-fetoprotein; AG = anion gap; AKI = acute kidney injury; ALP = alkaline phosphatase; ALT = alanine aminotransferase; ANA = antinuclear antibody; ANC = absolute neutrophil count; APS = antiphospholipid syndrome; aPTT = activated partial thromboplastin time; AST = aspartate aminotransferase; ATN = acute tubular necrosis; BHB = beta-hydroxybutyrate; BMP = basic metabolic panel; BNP = B-type natriuretic peptide; BUN = blood urea nitrogen; CBC = complete blood count; CCP = cyclic citrullinated peptide; CK = creatine kinase; CKD = chronic kidney disease; CMP = comprehensive metabolic panel; CRP = C-reactive protein; CSF = cerebrospinal fluid; CTX = C-telopeptide; DIC = disseminated intravascular coagulation; DKA = diabetic ketoacidosis; DOAC = direct oral anticoagulant; EDTA = ethylenediaminetetraacetic acid; eGFR = estimated GFR; FEUrea = fractional excretion of urea; HAGMA = high anion gap metabolic acidosis; HbA1c = glycated hemoglobin; HIT = heparin-induced thrombocytopenia; HHS = hyperosmolar hyperglycemic state; IDA = iron deficiency anemia; INR = international normalized ratio; LDH = lactate dehydrogenase; LFT = liver function test; LMWH = low molecular weight heparin; MAHA = microangiopathic hemolytic anemia; MCH = mean corpuscular hemoglobin; MCHC = mean corpuscular Hb concentration; MCV = mean corpuscular volume; MDS = myelodysplastic syndrome; MELD = Model for End-Stage Liver Disease; NPV = negative predictive value; OGTT = oral glucose tolerance test; PBC = primary biliary cholangitis; PCC = prothrombin complex concentrate; PE = pulmonary embolism; PMN = polymorphonuclear; PPV = positive predictive value; PSC = primary sclerosing cholangitis; PT = prothrombin time; RDW = red cell distribution width; RPI = reticulocyte production index; RTA = renal tubular acidosis; SAAG = serum-ascites albumin gradient; SBP = spontaneous bacterial peritonitis; SIADH = syndrome of inappropriate ADH; SLE = systemic lupus erythematosus; TIBC = total iron-binding capacity; TSH = thyroid stimulating hormone; TT = thrombin time; TTP = thrombotic thrombocytopenic purpura; ULN = upper limit of normal; vWD = von Willebrand disease; vWF = von Willebrand factor.
Final Integration
Laboratory interpretation is ultimately pattern recognition grounded in physiology. The best clinicians do not memorize isolated values; they build internal narratives that explain why a set of numbers makes sense (or doesn't) in a particular patient. When a panel comes back, ask four questions: What is abnormal? Why might this be abnormal? Does the pattern fit a known disease? What is the next test that will confirm or refute my working diagnosis? This discipline — applied to every panel, every time — is what separates clinicians who act on lab results from those who drown in them.
The chapters above work as a reference map, but the most important skill is the habit of returning to first principles whenever a result doesn't fit: verify the specimen, check for confounders, correct for albumin or glucose when applicable, look at the trend not the snapshot, and tie the pattern back to physiology. A clinician who does this consistently will out-perform any diagnostic algorithm, because the clinical question is always richer than the single number. And when the number truly is the answer — a critical potassium, a positive blood culture, a troponin rising on serial draws — the cost of hesitation is measurable in hours of injury. The work of lab interpretation is therefore equal parts skepticism and decisiveness, and both must be practiced deliberately.
Common Interpretive Traps Worth Memorizing
| Trap | Correct Approach |
|---|---|
| Treating pseudohyperkalemia | Verify non-hemolyzed plasma K before acting |
| Anchoring on a "UTI" in the elderly | Look for real source of delirium; ASB is usually innocent |
| Missing TTP in thrombocytopenia + MAHA | Never transfuse platelets; start plasma exchange |
| Folate before checking B12 | Always measure B12; neurologic disease may progress |
| Dismissing normal lactate in sepsis | 20% of septic shock has normal lactate |
| Missing euglycemic DKA on SGLT2 | Check gas + ketones regardless of glucose |
| Reading d-dimer without pre-test probability | Always apply Wells/Geneva before ordering |
| Treating subclinical hypothyroidism automatically | TSH 5–10 — treat selectively |
| Overcorrecting chronic hyponatremia | Strict limits; ODS is permanent |
| Equating ferritin with iron status in inflammation | Use TSAT, sTfR, or empiric iron trial |